March 2016 El Niño update: Spring Forward
The strong El Niño of 2015/16 is on the decline, and the CPC/IRI forecast says it’s likely that conditions will transition to neutral by early summer, with about a 50% chance of La Niña by the fall. In this post, we’ll take a look back at this past winter and forward to what may happen next.
Current events
El Niño has begun to weaken, with sea surface temperature anomalies across most of the equatorial Pacific decreasing over the past month. The large amount of warmer-than-average waters below the surface of the tropical Pacific (the “heat content”) also decreased sharply, despite getting a small boost in January. The heat content is the lowest it’s been in over a year, and since the subsurface heat feeds El Niño’s warm surface waters, this is another sign that the event is tapering off.
That said, there’s still a lot of extra heat in the tropical Pacific, and we expect El Niño’s impacts to continue around the world through the next few months. So far this winter, global rain and snow patterns have mostly been consistent with the expected patterns of El Niño, with some exceptions.
The winter that was
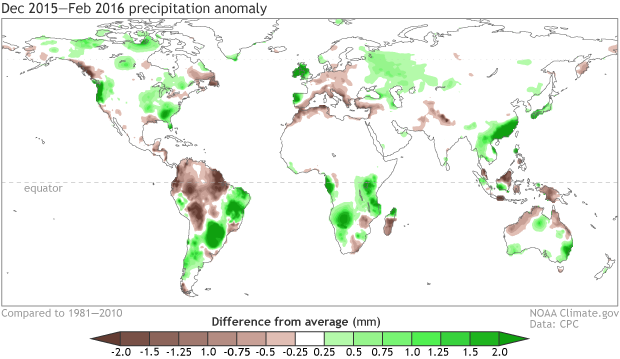
December 2015 – February 2016 rain and snow patterns, shown as the difference from the long-term mean. Climate.gov figure from CPC data.
In South America, southern Uruguay, Paraguay, and southern Brazil have received much more rain than their long-term December–February average, and the northern portion of the continent has been dry, as usually occurs this time of year during El Niño. Also consistent (so far) with El Niño’s typical impacts have been Africa’s rainfall patterns (wet in portions of Kenya and Tanzania and dry in southeastern Africa and southern Madagascar), the dryness through Indonesia and northern Australia, and the rains in southeastern China.
As Michelle discussed, the precipitation impacts in North America haven’t been quite as consistent with expectations so far, although the southeast and particularly Florida have received a lot more rain than average. Over the December–February season, the western coast of North America showed a pattern of drier north/wetter south, but the line between the two is shifted somewhat north of where it was during earlier El Niño events.
It’s a warm, warm world
El Niño’s effect on regional temperature is a little less distinct than its effect on precipitation patterns. Since El Niño changes the circulation of the atmosphere all around the world, it essentially changes where we expect rain to fall by steering storms to different locations. Temperature operates differently, especially since global warming is changing the averages. Michelle broke down some of the factors going into the super warm November and December in eastern North America – a good example of how attribution of seasonal temperature patterns is a complicated matter.
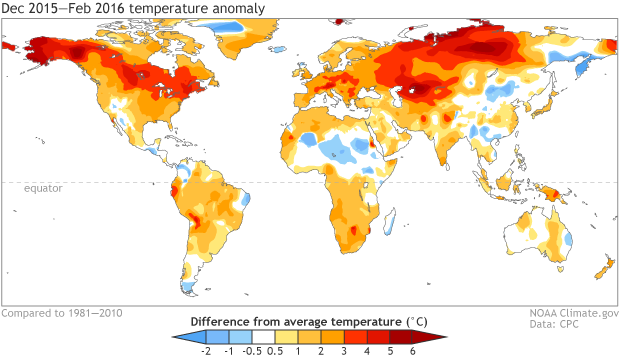
December 2015 – February 2016 surface temperature patterns, shown as the difference from the long-term mean. Climate.gov figure from CPC data.
Looking forward
Where does the 50% chance of La Niña come from? Forecasters take into consideration what happened in the past, the predictions of computer models, and current conditions when making their forecast.
La Niña conditions have followed six of the ten moderate and strong El Niños since 1950, including two of the three previous strongest El Niños. However, this small number of cases means that it’s hard to make a very confident forecast based only on the previous events.
Next fall is still many months away, and computer climate models have a difficult time making accurate forecasts through the “spring barrier” period of March–May, which is the time of year when El Niño and La Niña are often weakening and changing into neutral. It’s harder to predict a change in conditions. Nevertheless, most computer models are in agreement that La Niña (strength TBD) will develop by the fall.
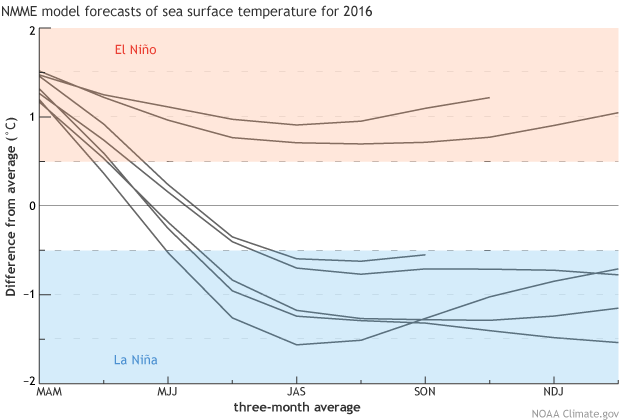
Forecasts from seven climate models for the 3-month-mean average sea surface temperature anomalies in the Niño3.4 region (Oceanic Niño Index). The first 3-month-mean period shown is March—May 2016, “MAM”; the last is December 2016—February 2017. Model data from the North American Multi-Model Ensemble (NMME). Climate.gov figure.
There are two models in this graph that are showing a return of El Niño. When a computer model forecast is made, you first have to tell the model what the current conditions are (“initializing” the model). For example, you tell it the current sea surface temperature, so it knows where to start.
The way we get a variety of possible outcomes is to start the models with slightly different initial conditions; the differences grow over time. Modelers can use different observation data sets, or use a few different recent days from a single data set, or use one set of observations and add in the range of uncertainty. (For more on observations, check out Tom’s excellent post.)
The two models that show a return to El Niño happen to use the exact same data set for the initial conditions. The prediction models are different, so they react to the initial data differently, which leads to different outcomes. However, this particular data set used for the initial conditions has unrealistically cold temperatures in the tropical Atlantic Ocean. This smells fishy so it is currently being investigated. The fact these two models are both predicting El Niño next winter could be related to this issue.
To ENSO researchers, this is pretty interesting, because the relationship between the Atlantic and the Pacific isn’t very clear. But right now, it means we aren’t placing a lot of weight on those forecasts for El Niño next year. The next few months should give us a clearer picture.
Comments
Excellent post!
Question - Probabilistic ENSO Outlooks
RE: Question - Probabilistic ENSO Outlooks
Hi David,
The official ENSO outlook released by CPC/IRI is issued the second Thursday of every month and is called the Consensus Probalistic ENSO Forecast. This forecast is based off a consensus approach of multiple human forecasters who each look at models and come up with their own individual forecast.
IRI releases a strictly model based probabilistic ENSO forecast as well later on in the month. This product has no human input and is strictly derived from what the climate models say.
RE: RE: Question - Probabilistic ENSO Outlooks
RE: RE: RE: Question - Probabilistic ENSO Outlooks
The Consensus Probablistic ENSO Forecast is the official forecast for CPC and NOAA and would recommend using that one. Forecasters would certainly use the model based probabilistic ENSO forecast but then adjust it as they see fit.
RE: RE: Question - Probabilistic ENSO Outlooks
EL Niño outlook in Peru
North Pacific warm water "blob"
Nicely done, If LA Nina comes
Cold tropical Atlantic, continuing El Nino
RE: Cold tropical Atlantic, continuing El Nino
Hi Fred,
The two models are the NCEP-CFSv2 and NCAR-CCSM4. Both are initialized with the CFSR (CFS Reanalysis), which is showing an unrealistically cold Atlantic.
odds of a step-up in global average temperature
RE: odds of a step-up in global average temperature
Our sister blog, Beyond the Data, has published two recent articles relating to El Nino's affect on the climate: about the recent streak of warmest months on record, and about El Nino's role in the 2015-16 US winter. See especially the last section of the "warmest months on record" post - essentially, El Nino tends to produce a spike in global temperatures, but the base that spike starts from is already set by the global warming trend.
precipitation departure map
RE: precipitation departure map
This is a little confusing, for sure. The quantity shown is mm/day, averaged over the 3-month period. So, you'd multiply by 92 (the number of days in Dec-Feb) to get the whole season's total anomaly, putting the darkest green at greater than 194 mm for the season.
Himalayan precipitation
Question
RE: Question
Please ask this question in less formally mathematical, more layman-friendly terms. Also, say over what locations, and during what time(s) of the year, your question is aimed. Even for mathematically savvy readers, the question remains far too vague. A temperature forecast does indeed differ under El Nino vs. La Nina conditions, but not everywhere, and not at all times of the year. But without clarification of your question, both in its style and its content, it is impossible to asnwer it intelligently.
Comments have been disabled on this article