A 'Hitchhiker's Guide' to the June 2025 ENSO update
The Pacific Ocean has hit pause and settled into ENSO-neutral conditions, which are expected to continue through the Northern Hemisphere summer. This makes seasonal forecasting for upcoming global rain, temperature, and other patterns a bit trickier.
The odds of La Niña increase through the fall but remain lower than the odds of neutral. By the November–January period, there’s a 48% chance of neutral and a 41% chance of La Niña, with El Niño a distant third. Grab your towel, today we’re touring the galaxy of ENSO-neutral and what it means for seasonal prediction.
The story so far: what ENSO is, and why it matters
El Niño and La Niña, known collectively as the El Niño/Southern Oscillation (ENSO), are a system of changes in the tropical Pacific Ocean and atmosphere. El Niño and La Niña alter global atmospheric circulation and the jet streams, affecting weather patterns around the world. El Niño and La Niña can often be predicted many months in advance, giving us an early heads-up for their impacts. ENSO-neutral conditions are in place when neither El Niño nor La Niña are present, and the tropical Pacific Ocean and atmosphere are close to the long-term average temperature and circulation.
El Niño and La Niña have expected impacts on global seasonal weather and climate, but what about neutral? ENSO-neutral doesn’t mean we expect upcoming seasonal rain, snow, and temperature to be close to average. Rather, during neutral, we don’t have the same predictive information that El Niño and La Niña’s atmospheric changes provide, making upcoming patterns harder to predict very far in advance.
The restaurant at the end of the universe: what’s happening in the Pacific right now
Our primary ENSO measurement, the temperature of the Pacific Ocean surface in the central tropical Niño-3.4 region, has been near average for the past few months, following last winter’s dip below the La Niña horizon. According to our most reliable sea surface temperature dataset, the Niño-3.4 region was 0.2°C (about 0.4°F) cooler than the long-term average in May.
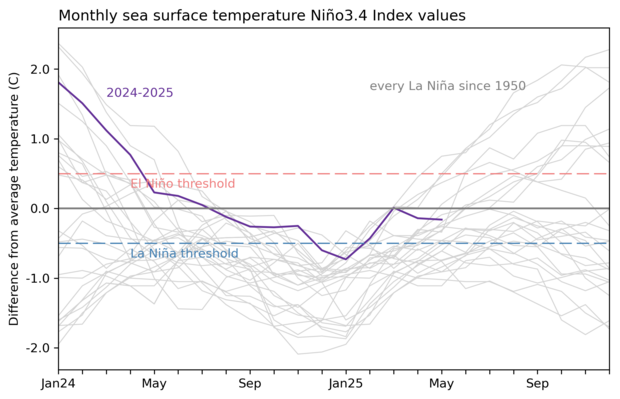
2-year history of sea surface temperatures in the Niño-3.4 region of the tropical Pacific for all La Nina events since 1950 (gray lines) and the recent (2024-25) winter (purple line). The Niño-3.4 index has been near average for the past three months. Graph by Emily Becker based on monthly Niño-3.4 index data from CPC using ERSSTv5.
The atmospheric circulation over the tropical Pacific also has looked mostly neutral. This overturning pattern, called the Walker circulation, is characterized by rising air over the far western Pacific and Indonesia, west-to-east winds aloft, sinking air over the eastern Pacific, and the east-to-west trade winds near the surface. During La Niña, the Walker circulation strengthens, while El Niño weakens it. A few La Niña-ish characteristics are still hanging around, including more rising air and more rainfall than average over Indonesia with some regions of stronger easterly trade winds over the tropical Pacific. Despite those fading, localized signs of La Niña, the ocean-atmosphere system across the Pacific as a whole is neutral.
We demand rigidly defined areas of doubt and uncertainty! What the models say about months ahead
It’s very likely that ENSO-neutral conditions will remain through the summer. By the fall, chances of La Niña do increase, but they are still lower than the chance for neutral. El Niño is the least likely, with odds of less than 1-in-8.
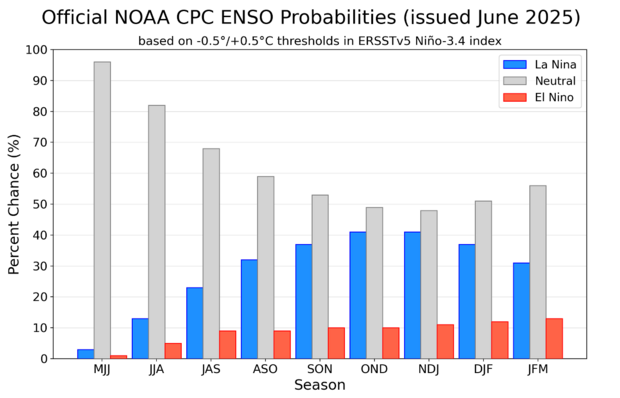
Out of the three climate possibilities—La Niña, El Niño, and neutral—forecasts say that ENSO-neutral conditions (gray bars) are most likely for the Northern Hemisphere spring and summer. Looking out to the fall, neutral is still the most likely, but chances for either La Niña (blue bars) or El Niño (red bars) are increasing. NOAA Climate Prediction Center image.
This forecast is informed by computer climate models, including those from the North American Multi-Model Ensemble. We consider lots of climate models, which gives us a range of potential outcomes. Most of these model runs fall into the neutral category through the end of 2025, with some in La Niña, and a few in El Niño, informing our forecast probabilities.
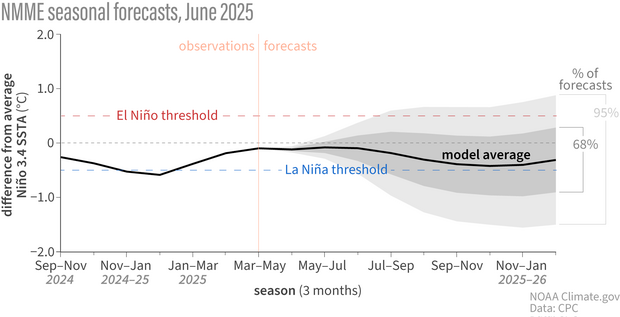
Line graph showing observed and predicted temperatures (black line) in the key ENSO-monitoring region of the tropical Pacific from spring 2025 through the fall. The gray shading shows the range of temperatures predicted by individual models that are part of the North American Multi-Model Ensemble (NMME, for short). By late summer, the shading spans from El Niño to La Niña, showing the range of potential ENSO states. However, the majority of model forecasts are concentrated in the neutral range, meaning the highest chance is that the temperature in the Niño-3.4 region of the tropical Pacific will be near average. NOAA Climate.gov image, based on data from the IRI.
In addition to the climate models, we study current conditions in the ocean and atmosphere. One valuable source of information is the pattern of water temperature under the surface of the Pacific Ocean. Our colleague, Caihong Wen of NOAA’s Climate Prediction Center, has been studying ENSO oceanic signals for years. She pointed out that there is a very narrow band of slightly warmer-than-average subsurface water near the thermocline along the equator, with large regions of cooler subsurface water to the north and south.
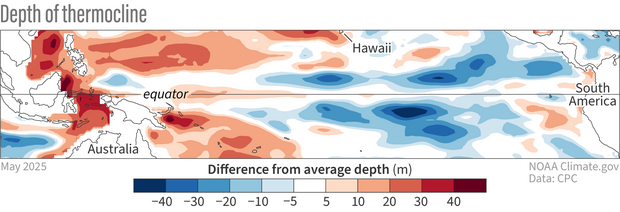
This map shows the temperature pattern under the surface of the tropical Pacific Ocean. The colors show how much deeper (red) or shallower (blue) than average the 20-degree temperature line lies. More warm subsurface water is present where the 20-degree isotherm is deeper than average (red), while cooler water is indicated when the 20-degree line is closer to the surface (blue). There is a narrow strip of warmer subsurface along the equator in the western and central Pacific, flanked by large areas of cooler subsurface to the north and south. In the past, this pattern has preceded second-year La Niña events. Figure by climate.gov based on original from Caihong Wen.
Caihong led some interesting research a few years ago showing that this off-equator subsurface water can provide a source for a developing El Niño or La Niña event. For example, a pattern of cooler subsurface water like we’re seeing now preceded second-year La Niña events in 2008, 2011, and 2017. It’s not a strong enough relationship for a confident prediction of La Niña, but it may help explain why some of the model forecasts are tilting in a La Niña-ish direction.
Infinite improbability drive
Let me leave you today with a reading selection from our past 11 years of ENSO blogs, since we didn't get around to it on our birthday last month. Curious about how ENSO helps with predicting tornadoes? Check out these posts from 2017, 2021, and just last month. ENSO influences the hurricane season—find out more in these articles from 2014, 2017, and 2024. Weather and climate extremes—including drought, heatwaves, atmospheric rivers, coastal flooding, and the range of daily temperature—are affected by El Niño and La Niña. Our runaway most popular post was about how ENSO changes snow patterns (read the La Niña follow up post here). We chronicled the strong El Niño events of 2015–16 and 2023–24, the endless La Niña of 2020–23, and had some fun along the way. Our smart, inquisitive audience, and the relationships we’ve formed along the way, make this the best place to be on the internet. Thanks for reading!
Comments
the criteria to judge strength of ENSO
You have mentioned above el nino of 2023/2024 is strong. Yes. It is very strong when you refer to ONI. It had a very large area of hot Water in equatorial Pacific. But MEI only supports medium strength. If you look at SOI or trade wind, it is similar to weak el ninos.
So when cpc to judge it is el nino(la nina)or not. You need consider atmospheric response, But if it is already an el nino. The strength only refer to its oceanic side?
Strength of 2023/24 El Nino
You make some very fair points - the 2023/24 El Nino was strong based on the peak ONI value, but it was only of moderate strength by other measures. We should consider these other criteria when judging the strength of an ENSO event (and believe me, we on the ENSO Blog and NOAA forecast team do consider these factors), and the reference to a "strong El Nino" in 2023/24 is specifically only considering the current, officially adopted primary metric for measuring ENSO strength (ONI).
Models
Hi Nathaniel,
Seems to me the models at this time of year have also overestimated the strength of SSTs in the EP. This year, the temps last year peaked above -,7. The models including the NMME last season where showing temps below -1.0 . Maybe these same models are overestimating SSTs. I know the CFSv2 is notorious for forecasting SSTs far below what actually transpires during winter.
overconfidence
It's certainly possible. The NMME was guilty of being too aggressive with La Nina development last year around this time. Even though the La Nina lean is not as strong this year, maybe it's still too strong? We can't rule that out.
How la nina affects u componets on jets and aam
Does La Nina remove/weaken the +u component on the pacific jet ( and lower aam in general) by decreasing the difference Between ssts in the eq and ssts in the mid latitudes which then weakens the jet stream and lowers aam . ( the reason i think this is that the jet stream is stronger in winter when temp differences are bigger between the tropics and poles so i figured it could be something similar here). Or is it more of shifting convection over to the Indian ocean which is associated with more of a -pna. (if the first option is right I now realize why the roni could be useful but then it begs the question why werent we always using it). If i have made any mistakes feel free to let me know as I have only begun tracking this stuff six months ago.
La Nina effects on jet stream/aam
I think the reason is more related to the latter - the shift of the tropical convection pattern during La Nina forces a negative PNA-like pattern that leads to a retraction of the North Pacific jet stream. These responses are never as simple as the most basic theory, and there are reinforcing feedbacks from transient eddy fluxes. So, I don't think I could rule out some role for the changes in baroclinicity associated with the change in the north-south temperature gradient.
As to why we haven't been using RONI sooner, I just have to leave that to the community at large. Thanks for your question!
roni
Thank you, But now i have to ask why the roni would be more useful than the oni?
RONI vs ONI
I think the last two posts I wrote get into the primary reasons. I would recommend checking them out here and here. If you want a more in-depth and technical explanation, this paper and the references therein are good too.
Spring Barrier
We are in Mid June. While we might not be past the spring barrier yet, would it be fair to say we are crossing through the barrier right now?
barrier crossing
That's a fair assessment. I don't know if there's any "official" crossing of the barrier, but there tends to be a notable jump in forecast skill from May to June initializations. So I think it's reasonable to interpret such a crossing to occur in June.
Barrier
Thanks Nathaniel
More recent nina
Is there any studies as to why there's been more ninas recently? Do we know if it's just natural variability and will go away or if it's tied to the -pdo or the strengthening of the walker circulation. As a dc snow lover i certainly hope its natural variability and we stop getting these evil Ninas so often and get more ninos so we can suppress the se ridge and enhance that stj to get those big storms. I think the pdo flip should help with this (should happen soon) but still getting nina what feels like almost every year as a dc snow lover is well saddening.
La Nina trends
The recent increase in La Ninas is connected with the overall climate trends in the tropical Pacific, which is a very hot topic, as we discussed here on the blog a couple years ago. The bottom line is that we don't really know why we have seen a more La Nina-like trend in the tropical Pacific in recent decades: it could relate to the response to greenhouse gas and/or anthropogenic aerosol forcing or it could be connected with natural multidecadal variability (like the negative PDO phase you mentioned), or it could be a combination of those factors. This La Nina-like trend in tropical Pacific sea surface temperatures could be affecting recent La Ninas, like this study which argues that the trend in the east-west sea surface temperature gradient is contributing to more multi-year La Ninas. So, there's plenty of work on this topic being done, but there's still quite a bit we don't yet understand.
La Niña in the Far East
Why has ENSO returned to neutral indicators, but the climate in the Far East still shows very obvious La Niña characteristics?
re: La Nina in the Far East
I would need more context about what La Nina-like characteristics you are referring to, but I will raise a couple of general possibilities. First, some of the effects of ENSO on the Far East tend to be delayed, as they are relayed through the more delayed warming or cooling of the Indian Ocean. So, we summer impacts of ENSO on the Far East may be a delayed impact of the previous winter's ENSO (the so-called Indian Ocean capacitor effect). Another possibility, as we have raised repeatedly in the blog, is that the relative Nino 3.4 index is consistent with weak La Nina conditions even though the traditional Nino-3.4 index indicates neutral ENSO conditions. So, the atmosphere may be reflecting the fact that the tropical east-central Pacific is cool relative to the rest of the tropics.
Do you think atmospheric response of la nina will linger
Atmosphere have been more la nina like since 2018. Especially after 2022, la nina like condition is become more and more severe. Do think this condition will be permanent or not?
La Nina persistence
I know it feels like we're stuck in a preferred La Nina state, but I am confident that it's not permanent. (We did just have a pretty decent El Nino just a little over a year ago). We've had other periods when La Nina seemed to dominate, like from 1970-1976 (and two of those La Ninas were quite strong), and then we didn't have another La Nina until 1983. So, I cannot say when this current period of frequent La Ninas will end, but I suspect that it won't continue forever.
Comments have been disabled on this article