Tornado season 2025: active through April, and May is keeping pace
This is a guest post by Prof. Kelsey Malloy, with the Department of Geography and Spatial Sciences at the University of Delaware. She specializes in diagnosing the influence of climate on severe convective storm risk. She is also an accomplished blogger at Seasoned Chaos, which focuses on subseasonal-to-seasonal forecasting.
*****
On your mark, get set, go! The 2025 U.S. severe weather season is off to a formidable start. Preliminary storm report data from Storm Prediction Center (SPC) suggest a well above-average February through April, especially for tornado activity, which has tragically resulted in 35 deaths [footnote 1]. What goes into such an active tornado season? As the blog has covered before (here and here), La Niña increases the chance for a hyperactive season. And the atmosphere remained La Niña-ish into May, even though NOAA issued its final advisory in April. But how can we connect climate-scale phenomena like La Niña to weather?
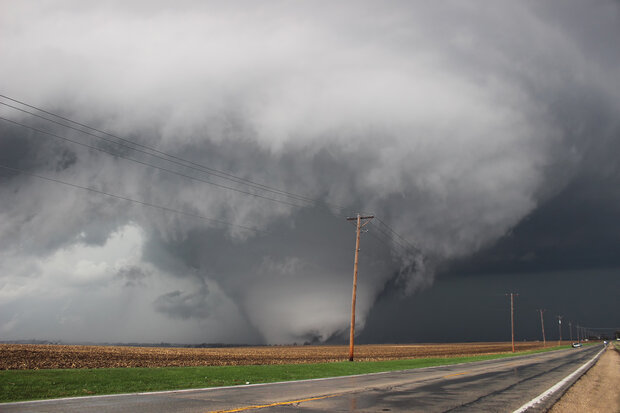
The powerful EF4 tornado that struck Fairdale, IL, in April 2015. Tornadoes happen in the U.S. every spring, but La Niña springs tend to have more than average. Adobe Stock photo.
First, consider this analogy for weather vs. climate: if weather is a single workout, climate is your overall fitness. It’s easy to understand how individual workouts (weather events) result in overall fitness (climate). But it’s actually a two-way interaction: just as your fitness determines the types or intensities of workouts you can do, the climate influences the types or intensities of weather events that can happen. This is one framework for thinking about how severe weather might be affected by ENSO.
Taking the analogy a step further, how do individual workouts add up to overall fitness? It comes down to lifestyle habits— good sleep, hydration, diet. If those are consistently in sync, you’re likely to have strong workouts and fitness gains. For weather and climate, the “habits” are described by subseasonal phenomena that shape day-to-day weather. In this post, I’ll explain how La Niña can lead to active tornado seasons through its influence on the Pacific-North American (PNA) pattern, or PNA for short.
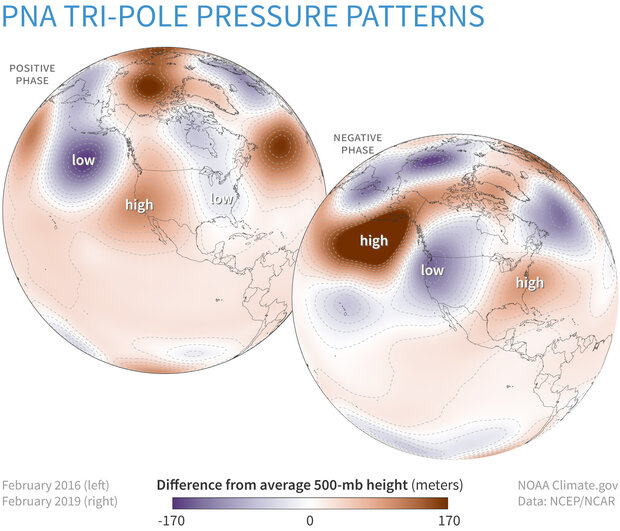
The Pacific-North American atmospheric pattern has two phases. The top map shows pressure patterns in February 2016 compared to the 1981-2020 average (positive phase), and the bottom shows February 2019 (negative phase). The location of highs and lows and the flow of the jet stream around them often produce a sharp warm-cold split in temperatures in the western and eastern halves of the United States. The negative phase is also linked to favorable conditions for tornado outbreaks. NOAA Climate.gov, based on data from the Physical Science Lab.
Feeling the (atmospheric) pressure this past March
Let’s zoom into a major recent tornadic event: March 14-15, 2025. Tornadoes arise from thunderstorms, which means first they need instability— warm, moist air near surface and cool, dry air aloft. That arrangement gives buoyant air the freedom to rise and produce convective (updraft-driven) rainfall. They also need wind shear — a change in wind speed or direction with height. Shear tilts the developing storm, strengthening updrafts and causing them to rotate.
If we look at the regions where convective rainfall was occurring on those days, plus the regions where instability and shear/rotation were most extreme, we can predict that where they overlap is where the greatest risk for tornadoes would have been located [footnote 2]. In terms of our analogy, it’s like how the alignment of good sleep, good hydration, and some timely carb-loading can lead to some of the best workouts.
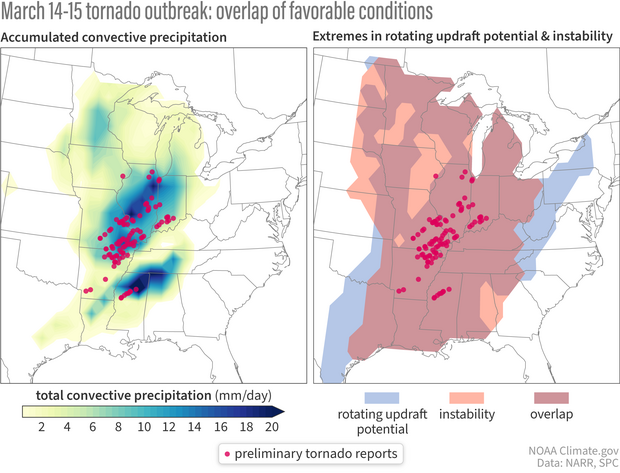
Tornado activity (red dots) during the March 14-15, 2025, outbreak was concentrated in areas where heavy convective rainfall (left map, darkest blue areas) overlapped with the areas of extreme atmospheric instability (right map, orange shading) and wind shear/rotation potential (right map, blue shading). Image by Kelsey Malloy.
Now, back to the big picture: why did these tornado-friendly conditions occur where and when they did? As you can see below, the U.S.-scale weather pattern for this day featured low pressure across the western-central U.S. and high pressure across the eastern U.S. Tornado reports (red dots) were found mostly between the high and low.
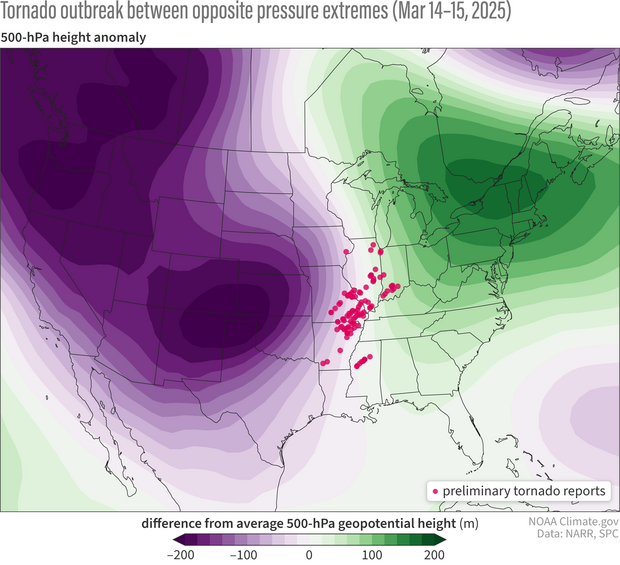
At the U.S. scale, tornado activity (red dots) during the March 14-15, 2025, outbreak was sandwiched between two different air masses: a relatively low-pressure area (purple) sitting south and west of a high-pressure area (green) to the north and east. This larger-scale atmospheric set up is often favorable to severe convective storms and tornadoes. Image by Kelsey Malloy.
A large pressure contrast like this often indicates favorable conditions for strong thunderstorms by marking the energetic collision zone between very different air masses—warm and moist from the south vs. cool and dry from the northwest.
ENSO sets the pace
The pressure pattern during the mid-March outbreak is one the atmosphere’s “preferred” configurations— the negative phase of the PNA, which I mentioned in the intro. Just like you can get into a habit of sleeping, hydrating, and eating well, which would lead to a higher chance of strong workouts, negative PNA can describe the “habit” (recurrence and/or persistence) of the atmosphere to set up tornado-friendly weather patterns, which would lead to a higher chance of tornadoes (Lee et al. 2024) The PNA was modestly negative for this day (-0.18) and the days leading up to the event [footnote 3].
And now we come back to the ENSO connection. As previous blog posts have described, La Niña has been linked to above-normal tornado and tornado-outbreak activity (Allen et al. 2015; Cook et al. 2008; Malloy and Tippett 2024). Outbreaks are when many tornadoes happen in a short amount of time, like the March 14-15 event. La Niña is also associated with more frequent negative-PNA days (see below). Therefore, the bridge between the climate-scale ENSO phenomenon and weather-scale tornado activity is that La Niña increases the frequency of tornado-friendly atmospheric pressure patterns like the negative PNA, and El Niño decreases the frequency of those patterns.
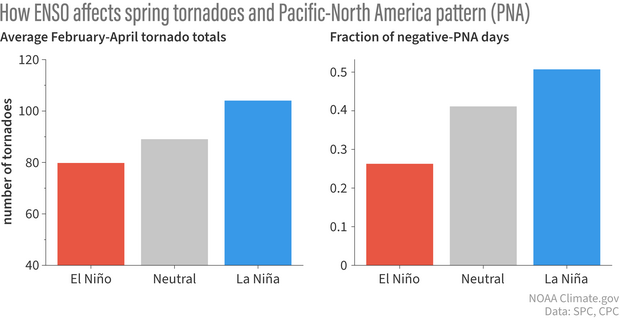
(left) Average monthly tornado numbers in the spring (February-April) during El Niño years (red) are less than during neutral years (gray) or La Niña years (blue). (right) During El Niño springs (red), the fraction of days during spring on which the atmosphere adopts a negative-PNA negative pattern is lower than during neutral years (gray). During La Niña years (blue), the fraction of negative-PNA days is nearly twice as high as during El Niño years. Image by Kelsey Malloy.
One thing forecasters want to know is how reliable these relationships between tornado activity, the PNA, and ENSO actually are. The graphs below tell that story. Each dot shows a single February-April tornado season (higher dots mean more tornadoes) and its ENSO state (La Niña on the left, El Niño on the right). In this plot, we are actually using a relative ENSO index—relative Oceanic Niño index (RONI)—due to its improvement in capturing this season’s La Niña and related teleconnections [footnote 4].
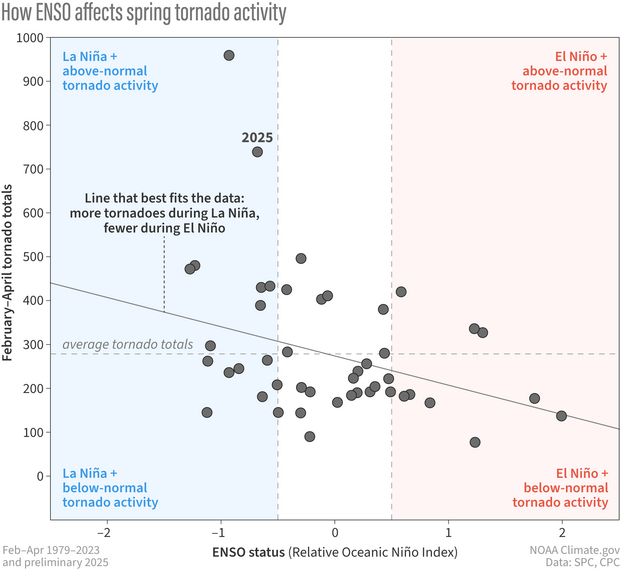
Seasonal tornado activity (height on the vertical axis) for each February-April from 1979-2023 versus the state of ENSO (La Niña on the left, El Niño on the right) based on the Relative Oceanic Niño Index. NOAA Climate.gov graphic, adapted from original by Kelsey Malloy.
Each quadrant on the graph represents possible ENSO-tornado groupings: upper left is La Niña with high tornado numbers, lower left is La Niña with low tornadoes, upper right is El Niño with high tornadoes, and lower left is El Niño with lower tornadoes. The relationship between tornado numbers and ENSO isn’t perfect, but the dots generally follow a downward tilting line: on average, more tornadoes happen during La Niñas [footnote 5].
The next graph is identical to the first except we are adding color to the dots to show the relative frequency of tornado-friendly, negative-PNA days during that tornado season. Pink means more negative-PNA days than average, and green means fewer than average. The darker the color, the bigger the difference from average.
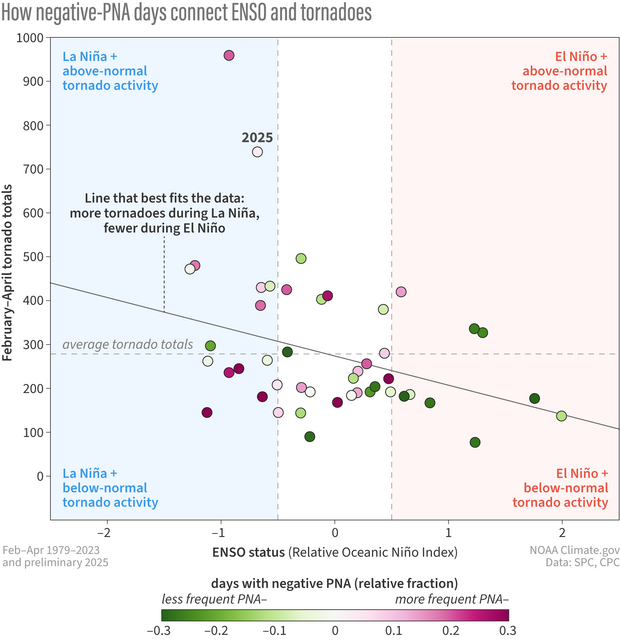
Same as above, but with color added to the dots to show the relative fraction of PNA-negative days in that season compared to average. Green means fewer negative-PNA days than average; pink means more frequent negative-PNA days than average. Springs with La Niña (blue shading) are more likely to have a higher-than-average fraction of days with a negative PNA (pink) value. NOAA Climate.gov, adapted from original by Kelsey Malloy.
The mostly green dots in the bottom right quadrant suggest that the below-normal tornado activity during El Niño is generally explained by fewer negative-PNA days. The atmospheric pressure patterns that cause alignment of tornado-favorable conditions happen less often.
On the flip side, most of the dots in the upper-left quadrant are pink, meaning above-normal tornado years are usually associated with La Niña and more frequent tornado-friendly, negative-PNA days. But there are plenty of pink dots in the bottom left quadrant, meaning that below-normal tornado seasons still happen during La Niña, even when the number of tornado-friendly, negative-PNA days is higher than average.
In other words, El Niño-related lack of frequent negative-PNA days usually leads to a below-normal tornado activity, but La Niña does not guarantee more frequent negative-PNA days or above-normal tornado activity. Coming back to our analogy, El Niño is like a noisy upstairs neighbor that is keeping you from sleeping well… its negative impact on a factor (sleep) surely could lead to frequent bad workouts. However, a quiet upstairs neighbor does not automatically translate to frequent good workouts.
In the case of February-April 2025, the general relationship between La Niña and above-normal tornado activity holds up. Its dot is in the “correct” quadrant. But…it is also pretty light pink, which means the number of tornado-friendly, negative-PNA days hasn’t been much above average. That suggests that this year, something else must be juicing up the tornado activity. [footnote 6].
No sign of slowing
At the time of my writing this, the month of May is continuing the momentum, with violent tornado outbreaks May 15-16 and May 18-20. This really underlines the need to better understand climate-scale, long-lead influences on severe weather. For instance, emergency managers would benefit from advanced notice of above-normal severe weather seasons. We’re still (storm) chasing the answers of how tornado variability is driven by climate, but it’s a chase worth pursuing, and I think we are making strides.
Lead Editor: Michelle L’Heureux
Footnotes
- Severe convective storms — those with damaging winds, large hail, or tornadoes — are getting some attention in recent years because they also have been major drivers of global insured losses. In fact, as of 2024, severe convective storms have surpassed tropical cyclones in terms of cumulated U.S. insured losses (Gallagher Re 2024). Besides the California wildfires, severe convective storms are again the leading natural driver of 2025 losses so far (Gallagher Re 2025).
- This approach of looking at environmental conditions also helps scientists overcome limitations of connecting climate to tornado reports since reporting practices rely too much on human factors and evolving technologies.
- Large-scale patterns can also be described by weather regimes, a way to break down atmospheric variability over North America into a set number of distinct patterns. It has been found that the Pacific Ridge weather regime, which looks a lot like PNA- pattern, is associated with tornado-favorable condition (Tippett et al. 2024).
- In recent blog posts (here and here), the ENSO bloggers have highlighted recent differences between the traditional method of measuring ENSO through the Oceanic Niño Index (ONI) and the relative Oceanic Niño Index (RONI), which takes into account overall tropical sea surface temperatures. Basically, we are dealing with a “sneaky” La Niña that has been stronger and has lasted longer in the RONI. Recently, the RONI appears to have been better at describing changes in tropical rainfall, circulation, and downstream teleconnections.
- Technically, the figure shows La Niña is associated with more tornado reports. But La Niña has also been linked to increased favorability of environmental conditions (also see footnote 2), so scientists feel confident that there is indeed a physical link here.
- Another major climate driver for tornado activity is the Arctic Oscillation (AO), and it has been shown that a positive AO is linked to above-normal tornado activity (Tippett et al. 2022). March 2025 monthly AO was indeed positive (~0.56), so this may have been a factor in why above-normal tornado activity was present.
References
- Kim, D., Lee, S. K., Lopez, H., Jeong, J. H., & Hong, J. S. (2024). An unusually prolonged Pacific-North American pattern promoted the 2021 winter Quad-State Tornado Outbreaks. npj Climate and Atmospheric Science, 7(1), 133.
- Allen, J. T., M. K. Tippett, and A. H. Sobel. (2015). Influence of the El Nino/Southern Oscillation on tornado and hail frequency in the United States. Nat. Geosci., 8, 278–283, doi:10.1038/ngeo2385.
- Cook, A. R., and J. T. Schaefer, 2008: The Relation of El Nino–Southern Oscillation (ENSO) to Winter Tornado Outbreaks. Mon. Wea. Rev., 136, 3121–3137, doi:10.1175/2007MWR2171.1.
- Malloy, K., & Tippett, M. K. (2024). A stochastic statistical model for US outbreak-level tornado occurrence based on the large-scale environment. Monthly Weather Review, 152(5), 1141-1161.
- Gallagher Re. (2024). Gallagher Re Natural Catastrophe and Climate Report: 2023. https://www.ajg.com/gallagherre/-/media/files/gallagher/gallagherre/new…
- Gallagher Re. (2025). Q1 2025 Gallagher Re Natural Catastrophe and Climate Report. https://www.ajg.com/gallagherre/-/media/files/gallagher/gallagherre/news-and-insights/2025/april/gallagherre-natural-catastrophe-and-climate-report-q1-2025.pdf
- Tippett, M. K., Malloy, K., & Lee, S. H. (2024). Modulation of US tornado activity by year-round North American weather regimes. Monthly Weather Review, 152(9), 2189-2202.
- Tippett, M. K., Lepore, C., & L’Heureux, M. L. (2022). Predictability of a tornado environment index from El Niño–Southern Oscillation (ENSO) and the Arctic Oscillation. Weather and Climate Dynamics, 3(3), 1063-1075.
Comments
Fairdale
That Fairdale IL EF4 is the only 4 to rate 200MPH since the 2013 Moore OK EF5.
Great article - thanks for the footnotes!
Very nice final plot (tornado totals against ENSO, with PNA relative fraction as colour) - seeing the evidence for causal mechanism chain ENSO -> PNA -> tornado total was clincher for me in allaying doubts on the linear fit to the scatter.
Loved the footnote detail too - notably on the confounding factors also at play e.g. Atlantic Oscillation (AO)! And onward links to the Tippett et al papers great - gave me answer (TLDR: yes!) to my question on whether anyone had done the modelling studies to complement the noisy observational record here, help disentangle the relative contributions of the various factors (ENSO vs AO vs ...) / teleconnections at play.
The Tippett et al 2024 conclusion looks v sound - by going to these large-scale regimes, more amenable to modelling than tornadoes themselves, and the nice work to marry up smoothed observed tornado reports & modelled tornado index, looks a great approach for being able to use any such insights-from-modelling to reinterrogate the observational record! Hopefully can use this as they say to get the impact modelling pull-through of forecast (sub)seasonal-to-climate modulations of large-scale patterns -> tornado outbreak risk!
Thanks, Edmund, we…
Thanks, Edmund, we appreciate the feedback!
something else
why there is not a new blog today?
Or CPC don't post a new blog every time after after ENSO update
It should be published soon…
It should be published soon. Sorry for the delay!
where is the June ENSO blog…
where is the June ENSO blog update?
It should be published soon…
It should be published soon. Sorry for the delay!
Comments have been disabled on this article