June 2022 ENSO update: how does your garden grow?
I’m definitely starting to sound like a broken record here! La Niña is favored to continue through the summer and into the winter. That said, chances of La Niña through summer have a fairly small edge over chances of a transition to neutral—52% for La Niña vs. 46% for neutral in July–September. There’s about a 59% chance of La Niña by early winter.
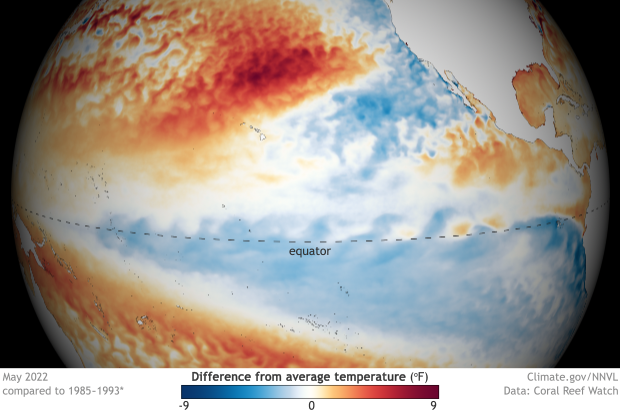
Sea surface temperatures in May 2022 compared to the long-term average (1985-1993, details from Coral Reef Watch). The equatorial Pacific was still cooler than average, and La Niña conditions remain in effect. NOAA Climate.gov image from Data Snapshots.
Dig deep
Speaking of broken records, let’s start with the sea surface temperature in the tropical Pacific. The three-month-average sea surface temperature anomaly in the Niño-3.4 region, specifically, according to the ERSSTv5 dataset. (The anomaly is the difference from the long-term average; long-term is currently 1991–2020.) This index, called the Oceanic Niño Index (ONI), is our primary metric for measuring ENSO (El Niño/Southern Oscillation), and the number that shows up in our historical ENSO chart dating back to 1950.
In March–May 2022, the ONI was -1.1°C, the second coolest March–May value we have on record. The first is 1950’s -1.2°C, back at the very beginning of the official record. The La Niña spring of 1950 was followed by a fall and winter that was technically ENSO-neutral, but on the cool side.
March–May 2022 is also only the second time during La Niña that the ONI has strengthened from the February–April average (-1.0°C in 2022). The other time that happened was also in the 50’s, with February–April 1955 measuring -0.7°C and March–May -0.8°C. Spring 1955’s La Niña persisted through the summer and strengthened into the winter 1955–56.
Looking at monthly averages, May 2022 was the second-strongest La Niña month on record, and by far the coolest of the eight two-year La Niña events that have occurred since 1950.
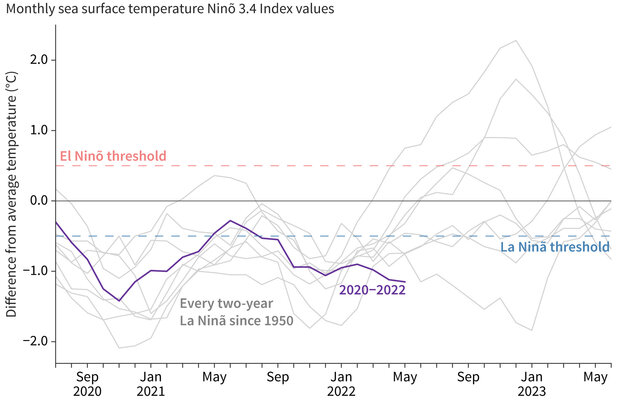
Three-year history of sea surface temperatures in the Niño-3.4 region of the tropical Pacific for the 8 existing double-dip La Niña events (gray lines) and the current event (purple line), which is the coldest of any of the previous events at this point in their development. Of all the previous 7 events, 2 went on to La Niña in their third year (below the blue dashed line), 2 went on to be at or near El Niño levels (above the red dashed line) and three were neutral. Graph is based on monthly Niño-3.4 index data from CPC using ERSSTv5. Created by Michelle L’Heureux.
Plant the seeds
Atmospheric indicators also continue to reflect La Niña, showing signs of a stronger-than-average Walker circulation, including enhanced trade winds and less rain and clouds over the central Pacific. These indicators were a bit weaker than the previous month, though, despite the stronger sea surface temperature anomaly. The cooler-than-average water under the surface of the tropical Pacific also weakened through May. Subsurface water provides a supply to the surface and can give an early hint to the direction we might expect the surface to go.
Many climate models are predicting that the sea surface temperature anomaly will also weaken in the next month or two—something we’ve already started to see over the last couple of weeks. These predictions, in combination with the weakening atmospheric response and reduced amount of cooler subsurface water, are leading to those fairly close probabilities for La Niña and neutral over the summer (52% vs. 46%). However, climate models predict the ONI will become more negative through the fall and winter, although even for those seasons, the potential outcomes are still spread across La Niña and neutral.
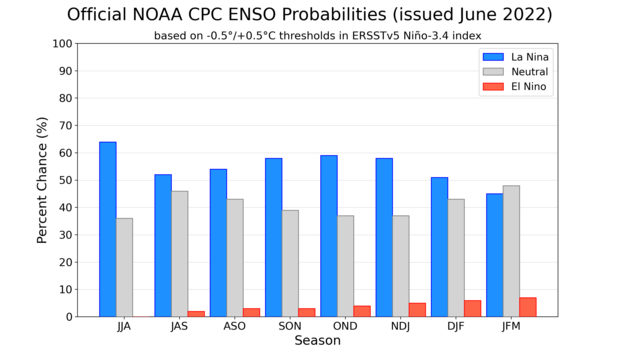
NOAA Climate Prediction Center forecast for each of the three possible ENSO categories for the next 8 overlapping 3-month seasons. Blue bars show the chances of La Niña, gray bars the chances for neutral, and red bars the chances for El Niño. Graph by Michelle L'Heureux.
Sun and wind and rain
Last month, I discussed the potential implications of a third-year La Niña for the ongoing US drought—check here for updated Drought Monitor and outlooks. This month in Potential La Niña Impacts (PLNI? That’s a terrible acronym!) it’s time to check out the Atlantic and Eastern Pacific hurricane season outlooks. NOAA released the 2022 outlooks late last month. It’s called hurricane season, but this includes both tropical storms, with maximum sustained winds of 39-74 mph, and hurricanes, with maximum sustained winds above 74 mph. I’ll just use “hurricane” here to stand in for both.
In summary, there’s a 65% chance that the Atlantic hurricane season will be above average (both a higher number of storms and overall stronger storms) and a 60% chance that the Eastern Pacific season will be below average. This is based on three categories, similar to the seasonal temperature and precipitation outlooks—above, near, and below-average—each of which would have a 33.3% chance of occurring if you had no other information. Since we have information about ENSO, climate change trends, and other factors, the hurricane season has some predictability, and we can make a forecast.

Typical influence of La Niña on Pacific and Atlantic seasonal hurricane activity. Map by NOAA Climate.gov, based on originals by Gerry Bell.
La Niña tends to increase the Atlantic hurricane season and decrease the Eastern Pacific season, primarily through influencing atmospheric shear. Shear is the change in the winds from near-surface to high in the atmosphere. When there is a large change between the lower- and higher-level winds (high shear), hurricanes get torn apart. When this change is reduced, they can grow and strengthen more easily.
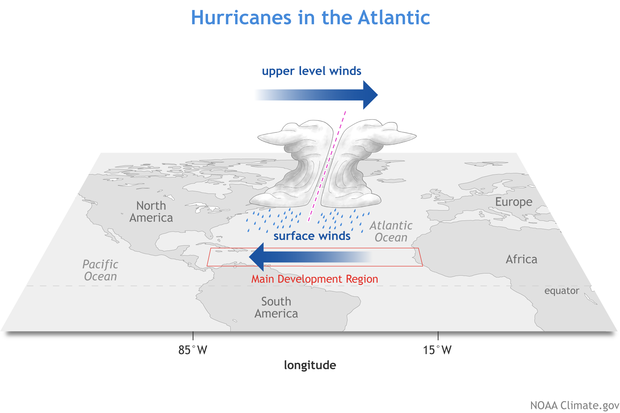
During hurricane season in the Atlantic, average surface winds are from the east, while upper-level winds are from the west, causing vertical wind shear that can act as a check on hurricane formation and growth. NOAA Climate.gov diagram.
La Niña slows the winds, especially upper-level winds, and decreases shear over the Atlantic Main Development Region, an area the Atlantic between 10–20°N where most Atlantic tropical storms and hurricanes form.
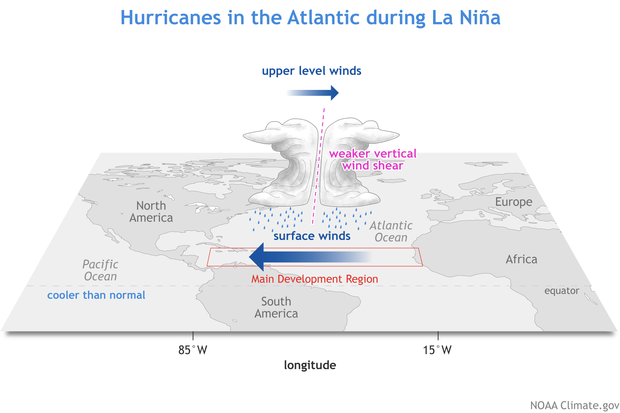
During a La Niña-influenced hurricane season, prevailing winds are weaker than average, especially the upper-level westerlies. Hurricanes experience less vertical wind shear. NOAA Climate.gov diagram.
Why does La Niña, which forms in the Pacific, slow the upper-level winds over the Atlantic? La Niña’s cooler central/eastern tropical Pacific ocean surface means more descending motion—part of the stronger Walker circulation. This descending motion draws air at upper levels toward it from all directions (think of a drain in a sink). The winds above the Main Development Region, which generally blow from west to east, are slowed by this pull toward the Pacific.
There are a number of other factors beyond La Niña going into NOAA’s outlooks, but it’s a big component. The outlooks themselves (Atlantic, Eastern Pacific) are very readable and have a ton of interesting nuggets about what to expect in 2022 and the science behind the predictions; I recommend perusing them for more information. Also, NOAA’s official press release has several interesting links about innovations in hurricane monitoring and the prediction of impacts such as storm surge or excessive rainfall.
Finally, if you live in a hurricane-vulnerable area (according to the US Census, this is at least 60 million Americans, not counting those farther inland who are at risk from inland flooding due to heavy rainfall!) it’s always a good idea to be prepared. NOAA has a helpful set of guides for hurricane prep here.
Comments
La Nina
The latest CFSv2 runs are trending away from a winter La Nina. The CFS was bullish on la Nina the last two years but is the bear now. The NMME seems to be the big cheerleader. We are rooting for the CFSv2 to be the winner. It shows positive anomalies in the Nino 3.4 beginning around January, Hopefully the upcoming CPC/IRI plume for June falls in line
ask
"Hopefully the upcoming CPC/IRI plume for June falls in line" Is this important ?
4th year La Niña possibilty
Enjoyed this update tremendously; however the latest May tropical Pacific surface temperature begs the question: Are we on the edge of witnessing a 4th year of La Niña? If so, is there a chance a new weather system is emerging (i.e. longer La Niñas) due to other not-so-obviously related climate variables? The melting Greenland ice sheet cooling the Atlantic (for the time being...) comes to mind.
This ongoing La Niña seems so strange. The Walker circulation's increasing cooling ability - when most other natural systems seem to be trending towards more heat - seems odd from a lay perspective. Would love it if this natural phenomenon could be unpacked more!
I'd suggest we have and…
I'd suggest we have and maintain a 3rd La Nina year before worrying too much about a 4th one. Hard to draw too many conclusions about links between multiple year La Nina's and climate change, although trends across the tropical Pacific during the past 50 years resemble La Nina, but there's no evidence that this pattern will continue.
I am not yet convinced we…
I am not yet convinced we will have a third year La Nina through the heart of winter as the odds are only 50/50 and some models are trending away from a La Nina through winter
Our probabilities have real…
Our probabilities have real world meaning. If we say something has a 58% chance of happening, then that means over a long historical record, it should happen 58% of the time (meaning it should *not* happen 42% of the time). We did keep track of these statistics... see our past post on forecast reliability here)
La Nina
Thanks Michelle
It drops to 51% by DJF and then down to 49% by JFM. We here in California don't care about La Nina much over summer and fall. We will be glad when it is finally dead and it appears La Nina could be dead by the heart of winter. While way too far away we are looking forward to see what the CFS is starting to show occuring In April In the meantime, I am hoping the IRI/CPC plumes for June make a move towards the CFS
Volcanic Forcing
Hi Emiley & everyone . Thank you very much for the updates . It is clear from your updates and model that the a 3rd Lanina impulse ( closer to be a weak Lanina ) is more likely the incoming winter .
Do your agree the plausibility of of weak next lanina in winter ?
I have a another quick question if you kindly have information whether the Recent Honga Tonga VEI-6 eruption may have a concerted inter-play on the ocean thermal measurements . Evidence suggests that these substantive eruptions are key influencers on the ENSO and weather patterns . I understand very well that the effects of volcanoes may differ spatially and temporally from place to another but many recent evidence suggests that our current models do not account for them as ingredients in the models we use for predictions , the volcanic forcings are not included as predictors in those ENSO predictive models in use today, are they ? . I believe that Not accounting for their effects on under-ocean and atmospheric levels may make our future climate modelling and outlooks more hazy and difficult to surmise , Do you agree with me ? .
Above all: Thank you and your team for the informative updates
Warmest Jordanian Regards
Mohammad Alkhateeb
Do hurricanes have any impact on the NA Monsoon?
Hello: I am curious if the above normal hurricane season detailed in your blog has any impact on the North American monsoon. Is there any relationship between these two weather seasons? Can these hurricanes help bring any precipitation to the Southwest? I have read the fairly conservative monsoon forecast for Central and Northern New Mexico released by the Albuquerque NOAA office earlier this month, but not clear if there is a relationship or not. New Mexico's 20-year drought has become so very dismal. Our forests and wildlife are all either burning up or dying of thirst and lack of food. Most of the conifers in Santa Fe have turned brown -- all forests and trails are closed to the public due to extreme fire danger. It does seem as if there are more and more La Nina years...
Thank you --
Mona Kay
Santa Fe, NM
I don't know much about the…
I don't know much about the N. American monsoon, but Emily has a great blog post on it here: https://www.climate.gov/news-features/blogs/enso/north-american-monsoon
The seasonal precipitation outlook is available here (updated once monthly): https://www.cpc.ncep.noaa.gov/products/predictions/long_range/seasonal.php?lead=1
For this summer at least there is some tilt in the odds toward wetter conditions for parts of southern Arizona. It's not a particularly high probability forecast though.
Thank you for the posts
I appreciate the relatively technical information that goes into these posts. And please don't hold back on more math, more models, and more science in the future.
Keep up the good work, and Thanks
Thank you for reading!
Thank you for reading!
Nino areas
As La Nina is mostly a Southern Hemisphere deviation (i.e. below the Equator) and El Nino is equally distributed both sides of the Equator, is there not a good case to move the 3, 3.4 and 4 boxes to the South of the Equator in order to more accurately reflect the La Nina/El Nino pattern differences?
ENSO and its core coupled…
ENSO and its core coupled dynamics are squarely in the tropics (approx 15S-15N) of the Pacific Ocean. Certainly there can be impacts outside of that region... like SSTs extending into the southeast Pacific, but that is not a pre-requisite for ENSO to occur. You may like Emily's blog post on various patterns that may precede ENSO itself... this is something we keep an eye on as well. https://www.climate.gov/news-features/blogs/enso/visit-zoo-climate-patterns-can-precede-enso
Nino areas
Do you accept that El Nino temperatures are equally distributed about the Equator both North and South, but that La Nina temperatures are mostly in the Southern Hemisphere?
The core dynamics of ENSO…
The core dynamics of ENSO really lie within the tropics.
https://www.climate.gov/news-features/blogs/enso/rise-el-niño-and-la-niña
Nino areas
That doesn't really answer the question. If you look at the sea surface temperature patterns for El Nino and La Nina, then the distribution either side of the equator is symmetrical in the case of El Nino but is asymmetrical in the case of La Nina.
La Nina
This is not always true
Questions for Michelle L’Heureux
You were recently quoted in an AP news article
Weather's unwanted guest: Nasty La Nina keeps popping up | AP News
as saying
"An Associated Press statistical analysis of winter La Ninas show that they used to happen about 28% of the time from 1950 to 1999, but in the past 25 winters, they’ve been brewing nearly half the time. There’s a small chance that this effect could be random, but if the La Nina sticks around this winter, as forecast, that would push the trend over the statistically significant line, which is key in science, said L’Heureux. Her own analysis shows that La Nina-like conditions are occurring more often in the last 40 years. Other new studies are showing similar patterns."
1. Is that quote correct?
2. Can you publish that analysis or at least the data source used and the methodology that allowed you to come to that conclusion.
Hi- keep in mind that the…
Hi- keep in mind that the qualifier "La Nina-like" is important. This doesn't mean perpetual La Nina. It means that the trend in sea surface temperature and sea level pressure is toward a stronger zonal gradient across the tropical Pacific, which is considered "La Nina-like." But my analysis is certainly not unique on this issue and many, many others have published on this. I especially like recent papers (here and here) by Richard Seager that confirms this tendency.
Questions for Michelle L’Heureux
I understand that temperatures below zero can be described as 'La Nina like' without being true 'La Nina' itself.
Models and NSO
Hi Michelle, greatly appreciate the blog and updates.
I was also curious about the AP article. Seth Borenstein wrote that "Scientists are noticing that in the past 25 years the world seems to be getting more La Ninas than it used to and that is just the opposite of what their best computer model simulations say should be happening with human-caused climate change," but the IPCC said there is no consensus on how ENSO will evolve in their last 3 reports. Are you able to clarify?
I've read Richard Seager's 2019 paper you linked above, so I have a little context to run with should you reply.
Regards,
Barry
I'm not Michelle but I can…
I'm not Michelle but I can try and answer as best I can. I covered what the IPCC report says about ENSO here > https://www.climate.gov/news-features/blogs/enso/enso-and-climate-chang…
And basically, there have been some changes but it's too difficult to say if climate change is the cause.
But the IPCC report isn't doing any new science but discussing the totality of science already done. There are groups of scientists who claim (with peer reviewed research) that El Ninos will be come more likely. That is what I imagine Seth Bornstein is referring to.
About the only thing for certain is that a lot more research will produced looking at this problem.
Here in Central America...
Here in Central America we are experiencing more and more rain. To be fair I haven't seen a May and June so rainy like the ones we are experiencing this 2022 in the last 38 years.
I'm afraid farmers and peasants will have serious impacts with this flash floods caused by the increase in rains. Seriously, this really affect us because brings a myriad of problems to our poor societies and the worst part is we don't play a major role in the climate change as those industrialized countries. We just suffer the consequences. Of course this brings a lot of immigration (legal or illegal) because people always seek a relief valve.
Less rain in Mexico
It seems La Niña has a strong drought effect on central Mexico where I have a small farm. I am desperate to feel more hopeful about the future and I do not want to believe the drought will become more common.
Mexico and La Nina
I understand how you feel. Yes, La Nina tends to bring drought to much of Mexico, particularly the northern half, like it does for the southern US. Hopefully the drought will ease in both the western US and northern and central Mexico.
Historic El Nino
Do you not think that the Nino 3.4 area (drawn from data from the Hadley Center HadISST)
nino34-4.jpeg (1200×600) (wordpress.com)
and the ENS ONI
Ensemble Oceanic Nino Index (webberweather.com)
both show the El Nino of 1878 was not statically dissimilar to that of 2016?
Others may extend the record…
Others may extend the record to times before 1950, but we feel comfortable making those comparisons only in records post 1950. There is likely a good amount of uncertainty that go along with sst measurements in the Pacific prior to 1950.
Original source for the ENS ONI
The Ensemble Oceanic Niño Index - Webb - - International Journal of Climatology - Wiley Online Library
is the original source for the extended Ensemble ONI.
Further support
Climate and the Global Famine of 1876–78 in: Journal of Climate Volume 31 Issue 23 (2018) (ametsoc.org)
further supports the concept than the El Nino of 1878 was not a trivial event.
Paper by Michelle L'Heureux et al.
How Significant Was the 1877/78 El Niño?
Boyin Huang, Michelle L’Heureux, Zeng-Zhen Hu, Xungang Yin, and Huai-Min Zhang
01 May 2020
"The strength of the 1877/78 El Niño appears approximately equal to those during 1982/83, 1997/98, and 2015/16."
Arriaga
The event El Niño 2023 - 2024????
Way too far out into the…
Way too far out into the future to speculate on that.
Comments have been disabled on this article