October 2022 La Niña update: snack size
For what seems like the 247th month in a row, La Niña is still in charge in the tropical Pacific. It’s really only been about a year with continuous La Niña, as it took a break summer 2021 and re-developed October 2021, but it seems like longer! There’s a 75% chance La Niña will be present this winter (December–February); forecasters favor a transition to neutral during February–April 2023.
3 Musketeers
Call it what you like—triple-dip, three-peat, three-bean salad—we are facing the third La Niña winter in a row. This is the third time in our historical record of ENSO (El Niño-Southern Oscillation, the whole El Niño and La Niña system), which dates back to 1950, that we have had three La Niña winters in a row. That’s a lot of threes! The other stretches were 1973–1976 and 1998–2001.
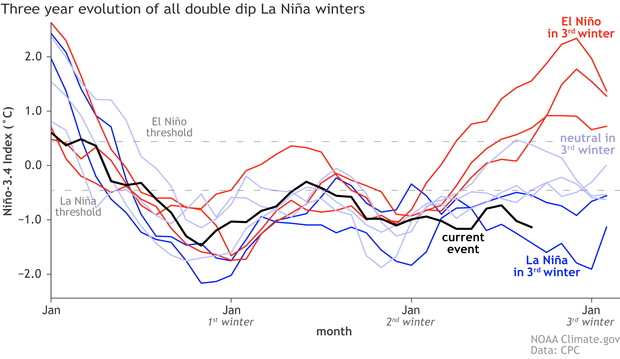
Three-year history of sea surface temperatures in the Niño-3.4 region of the tropical Pacific for 8 previous double-dip La Niña events. The color of the line shows the ENSO state in the third winter (red: El Niño, darker blue: La Niña, lighter blue: neutral). The black line shows the current event. Monthly Niño-3.4 index is from CPC using ERSSTv5. Time series comparison was created by Michelle L’Heureux, and modified by Climate.gov.
As I mentioned, La Niña conditions took a vacation last summer, but the Niño-3.4 index has been negative since mid-2020. The Niño-3.4 index, our primary measurement for ENSO, measures the difference between current and long-term average sea surface temperature in a specific region in the tropical Pacific, where long-term is currently 1991–2020. According to ERSSTv5, our favorite sea surface temperature dataset, the Niño-3.4 index ticked slightly more negative to -1.1°C in September 2022. This is approximately tied with 1999 for the 6th most negative Niño-3.4 index on record for the month of September.
Kit Kat
Forecasters are very confident that La Niña will continue through the end of the year: the probability of La Niña through October–December is 95%. I got into detail about the sources behind the high level of confidence last month, and they remain the same this month. First, there’s that Niño-3.4 index, substantially exceeding the La Niña threshold of cooler than -0.5°C.
Also, the La Niña atmospheric response is clearly locked in, shown by stronger-than-average near-surface winds along the equatorial Pacific Ocean (the trade winds), less rain than average over the central tropical Pacific, and more rain over Indonesia. All these factors illustrate an enhanced Walker circulation. One of the ways that we measure the Walker circulation is the Southern Oscillation Index (SOI), which relates the surface air pressure over Darwin, Australia to the pressure over Tahiti.

Location of the stations used for the Southern Oscillation Index (Tahiti and Darwin, black dots), the Equatorial Southern Oscillation Index (eastern equatorial Pacific and Indonesia regions, outlined in blue-green), and the Niño3.4 region in the east-central tropical Pacific Ocean for sea surface temperature (red dashed line). NOAA Climate.gov image by Fiona Martin.
September 2022 was the 4th strongest September SOI since 1950. Another measurement is the Equatorial Southern Oscillation Index, measuring the surface pressure relationship between the eastern and western equatorial Pacific. By this measure, September 2022 was tied for 10th strongest September since 1949. Not quite as impressive, but still a solid indication of the amped-up Walker circulation.
A third factor providing confidence is that there is still a substantial amount of cooler-than-average water under the surface of the tropical Pacific. Our records for the subsurface ocean temperature go back to 1979, and September 2022 is tied for 8th coolest September subsurface. Not a staggering record or anything, but enough to further bolster the forecast confidence. Yet more confidence comes from the computer model forecasts, nearly all of which predict La Niña will linger through the Northern Hemisphere winter.
Skittles
We spend so much time and energy studying La Niña and El Niño because they affect global atmospheric circulation, changing climate patterns in somewhat predictable ways. Check the second half of last month’s post for a collection of La Niña’s potential effect on North American and global weather and climate.
There are many different things that go into a seasonal forecast, but the two biggies are ENSO and recent trends, meaning the tendency of temperature and rain/snow over the recent 10 or 15 years. Tom described how the recent trends work, so take a look at that post for details.
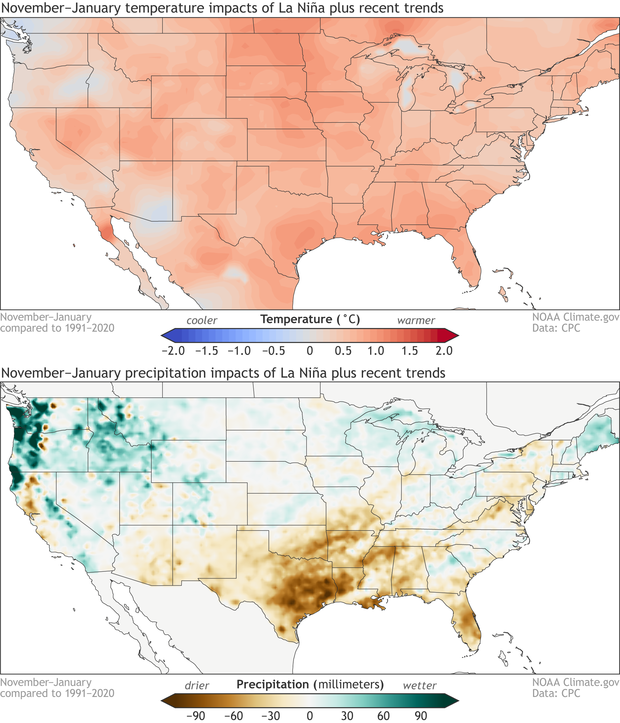
November–January average temperature (top) and precipitation (bottom) compared to the long-term average for the combination of historical La Niña events and climate trends. Data is based on the CPC ENSO composites and modified by Climate.gov.
Clearly, when you combine the characteristic temperature pattern of La Niña with recent trends, you end up with a warmer-than-average pattern during November–January over nearly the entire contiguous U.S. (You can see maps with La Niña and trends separated here.) Also, the southern plains tend to be drier than average, with more rain and snow falling in the northwest. (Separated maps here.) The Climate Prediction Center’s updated outlook for the November–January and upcoming winter will be released next Thursday.
Comments
Comment policy
La Nina
As La Nina wanes toward ENSO neutral during the later stages of winter, Feb-April, Could we expect any potential changes in weather patterns or is the current atmospheric response going to dictate our weather for the rest of winter?
Appears there are some signs of change brewing in the Pacific. A large pool of warm water has built up in the Western tropical pacific. At some point that warm pool is going to start migrating east. Would not be surprised to see an El Nino either next winter or the following winter.
ENSO still has a fairly…
ENSO still has a fairly strong relationship with US temperature and rain/snow in FMA. Even if La Niña has weakened substantially by then, it can still have some impact. Also, the atmospheric response doesn't necessarily shut off as soon as the SST no longer qualifies as La Niña, so I would think it's likely that La Niña will play a role in the FMA weather. The CPC's outlook for FMA generally reflects La Niña patterns. (These are from September and will be updated on October 20th.)
Regarding the warm subsurface--we are keeping an eye on that! And many climate models seem to be hinting at a warm-up in the Niño-3.4 region for next year. However, this is still pretty far away, so we'll have to wait for spring forecasts to have any real confidence.
La Nina
Thank you Emily!
I was told at one time that it can take several weeks for the atmosphere to respond to changes in ENSO
La Nina drought
Here in Kentucky we been having a very severe drought since mid September. We also are having Arctic cold fronts come through the state with very little precipitation. I was wondering if La Nina is causing this to occur ?
La Nina and Kentucky
I doubt that La Nina is having a major influence on the recent drought and cold front intrusions in Kentucky. If you check out the CPC's composites page, you will see that the typical influence of La Nina on Kentucky temperature and precipitation is pretty modest in the fall. A linear regression analysis from this site suggests that there may be a minor La Nina dry influence on Kentucky in the fall, but this sort of influence is not expected to last through the winter. So, I suspect that chaotic weather variability is the main culprit, but I wouldn't rule out some influence from La Nina. We'll keep an eye on it - thanks for the question!
Arriaga
El Niño in dicember 2023?
December 2023
It's too early to make an accurate forecast for December 2023 - we're still focused on getting December 2022 right! I'll state my unofficial opinion that we're more likely to see El Nino than La Nina in December 2023, but mother nature never ceases to surprise me.
Such cold water!
The degree of cold water coming up in the eastern Pacific, is that notable? I have read that the oceans are warming, should we be worried that so much cold water is being moved up? I presume that warmer water is taking its place (because something has to, right?), hopefully also getting as cold as it sinks, but is it possible the depths will warm up a little? or is this cold measure just look colder because we've moved into the newer decade for comparison?
Or is all of this happening above a certain depth (thermocline, I think?) and I'm just clueless? (which is possible!)
Thank you again for all your hard work in this very interesting subject!
These recent La Ninas have…
These recent La Ninas have been remarkable for their persistence, but I would not say that the magnitude of the cold water currently in the tropical Pacific is particularly remarkable - the September Nino 3.4 index was the 7th lowest since 1950, so it is a healthy La Nina but currently not one of the strongest. You can get more information on the current state of the Pacific in the context of recent observations at this site.
In terms of the long-term trend, the oceans have been warming up consistently overall, but the eastern tropical Pacific (the main ENSO region) has not. This is a bit of a puzzle for climate scientists, and an important one. Look out for a post on this topic on the ENSO Blog sometime in the coming months.
Thank you!
Thanks for your response, Nathaniel, I'll keep an eye out for the post about the eastern Pacific cold waters. That is very interesting!
La Nina 1&2 temps
Is it normal to see such cold SSTs in the Nino 1.2 region? That region has experienced colder SSTs than the 3.4. Last year the region saw temps at times hitting lows of -2.5 and currently has fallen close to -2.
The Nino 1+2 region indeed…
The Nino 1+2 region indeed has turned a bit chilly the past few weeks, but this region does tend to have a considerable amount of week-to-week variability. Looking at the longer-term time series, we can see that there have been comparable periods over the past 20 years. If the Nino 1+2 temperature anomalies stay around -2C, however, then it would be a pretty notable anomaly.
La Nina and the teleconnection NAO relationship
Are there any signals that suggest the NAO this coming Winter will go to a record breaking negative phase ? I read an article that this happened in the Fall and Winter 1917-18. A very severe Winter and it was an ENSO- La Nina year.
It is much more difficult to…
It is much more difficult to predict the NAO/AO state months in advance. Unfortunately this climate mode is "noisy" meaning that you can see extreme values and we can't see them coming well in advance. With that said there is a *small* predictable signal in the NAO/AO that is related to ENSO. What research says is that La Nina tends to be associated with a stronger polar vortex (positive values of NAO and AO). So a weaker polar vortex seems less likely this coming winter. With that said, I want to emphasize that this is a small signal and can be easily be wiped out if there is, say, a sudden stratospheric warming (SSW). Unfortunately SSW are not predictable more than 1-2 weeks in advance.
reply
Thank you Michelle, Looking forward to the monthly updates !
Uneventful Winter ?
I'm expecting an uneventful Winter here in the Ohio Valley due to La Nina's typical effects. Are there any signs or signals showing up that may end this La Nina before Spring ? Looking forward to your reply.
At this point we are…
At this point we are expecting La Nina to last through January-March, with Neutral slightly favored in February-April. This can change though... we update our outlooks every month here (2nd Thursday of the month):
https://www.cpc.ncep.noaa.gov/products/analysis_monitoring/enso_advisory/ensodisc.shtml
reply
Thanks for the reply. Will be reading the monthly updates on ENSO phases.
La Nina
What is the present outlook for a big blocking high in the North Atlantic due to the present La Nina that would bring Colder weather to the United Kingdom ?.
Comments have been disabled on this article