GHG Research & Modeling
Where do GHGs come from and where do they go?
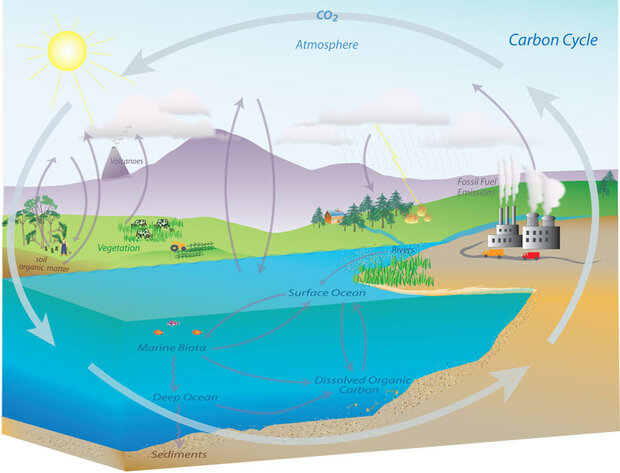
Identifying and quantifying all the sources and sinks of greenhouse gases (such as carbon dioxide, nitrous oxide, & methane) is a complex challenge that requires direct and indirect measurements, modeling efforts, and collection of data across a variety of sectors and systems. Some sources, such as carbon dioxide emissions from burning fossil fuels, can be estimated with high accuracy. However, sources of methane emissions are more variable and, therefore, more difficult to measure.
Download the State of the Science Fact Sheet PDF
Projected cumulative land and ocean CO2 uptake by 2100 under future Shared Socioeconomic Pathways scenarios, WG1 SPM IPCC
Historically, land and ocean have taken up over 50% of human- emitted carbon. Under future scenarios scientists used to analyze feedback between climate change and socioeconomic factors, as human emission of carbon dioxide increases, land and ocean sinks are projected to be less effective at slowing its rate of accumulation in the atmosphere. To understand past responses of Earth’s climate system to greenhouse gas emissions, and to project future changes in land and ocean carbon sinks and sources as well as atmospheric CO2 concentrations, NOAA scientists develop and use advanced computer models that simulate biological, chemical, and physical processes.
Download the Summary For Policymakers PDF
Climate projections on a timescale from decades to centuries are based on plausible scenarios of carbon emissions, sulfur emissions, land use changes, and other human-caused factors (called "forcings"). Computer models of greenhouse gases help us to understand how sources and sinks of greenhouse gases are changing over time, and how they will evolve in the future.
NOAA uses two complementary modeling strategies.
- Land and ocean ecosystem models
Exchanges between the ocean, land, and the atmosphere are simulated based on understanding from theory and observations. These models are often referred to as "bottom-up" models. - Data assimilation / flux inversion models
Statistical approaches to integrate information from bottom-up models and inventories of human emissions, based on economic data, observations, and models, to estimate sources and sinks of greenhouse gases. - Coupled carbon, chemistry climate Earth system models
Coupled physical energy and water dynamics of climate, chemistry and carbon are coupled between the atmosphere-ocean-land-ice system to understand the GHG role in climate and feedbacks.
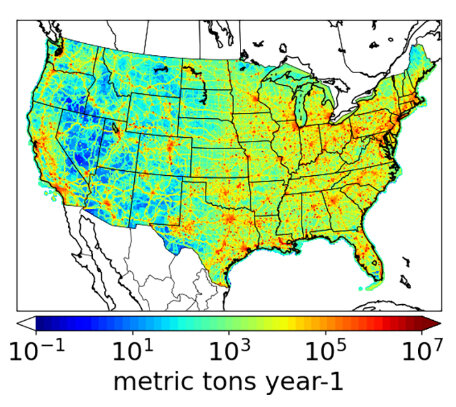
GRA2PES CO2 v1.0 2021 annual total fossil fuel carbon dioxide (ffCO2) for the continental U.S. Unit: metric tons ffCO2/year. CONUS total: 1351 TgC/year. Credit: Congmeng Lyu, NOAA / CIRES
NOAA and the National Institute of Standards & Technology (NIST) are working together to develop an improved capability to measure and model U.S. emissions of greenhouse gases and hazardous air pollutants, called the Greenhouse Gas and Air Pollutants Emission System (GRA2PES). The goal is to support both researchers' and decision-makers' ability to formulate emission reduction strategies and to monitor changes over time.
Read more at the NOAA Chemical Science Laboratory
Related articles
- What is the carbon cycle?
- What are global climate models and what are their uses?
- The Geophysical Fluid Dynamics Laboratory (GFDL) Earth System Model version 4.1
- Download the Shared Socioeconomic Pathways GHG emission scenarios PDF
- NOAA CarbonTracker Tool
- NOAA CarbonTracker Methane Tool
- NOAA GFDL Earth System Models
- Greenhouse Gas And Air Pollutants Emissions System
- How NOAA's observations help EPA track GHG emissions
- U.S. Emission Tracker for Potent GHGs
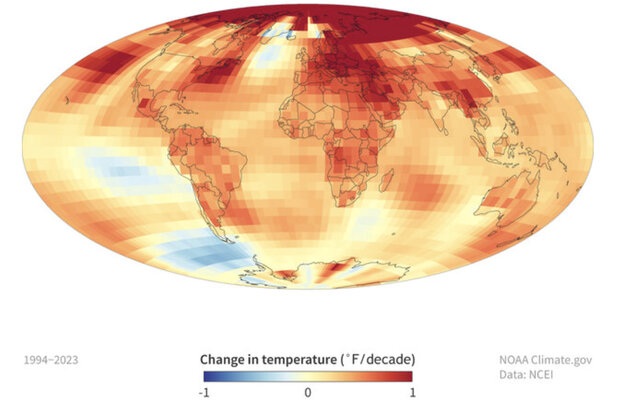
Rising amounts of human-emitted greenhouse gases are preventing Earth’s surface heat from escaping into space as freely as it used to. The buildup of heat-trapping gases is causing our world to warm unusually rapidly. The map shows the rate of change in surface air temperature for the period 1994-2023.
Read more about global temperature on Climate.gov
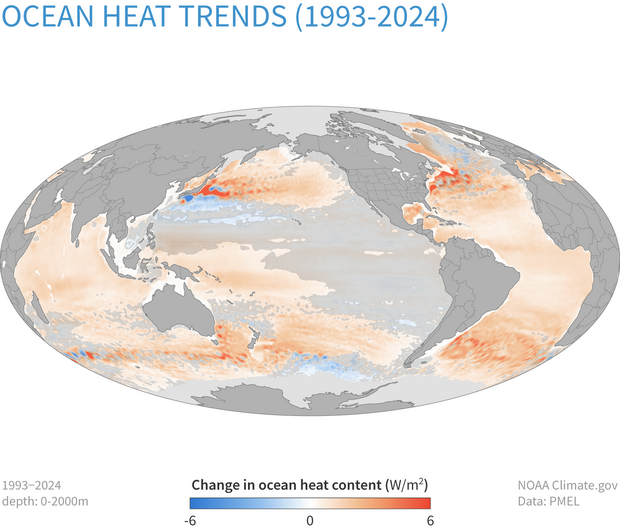
Most of the excess atmospheric heat (about 90 percent) is passed back to the ocean. As a result, upper ocean heat content has increased significantly over the past few decades, causing global mean sea level to rise and producing marine heat waves that harm ocean life forms. The map shows ocean heat trends from 1993-2022.
Read more about ocean heat content on Climate.gov
Humans annually emit about 39 billion tons of carbon dioxide into the atmosphere. Roughly 25 percent of that amount is absorbed by the ocean. NOAA’s Global Ocean Monitoring and Observing (GOMO) Program provides long-term observations of carbon from the ocean’s surface to the sea floor.
Read more at NOAA Global Ocean Monitoring & Observing
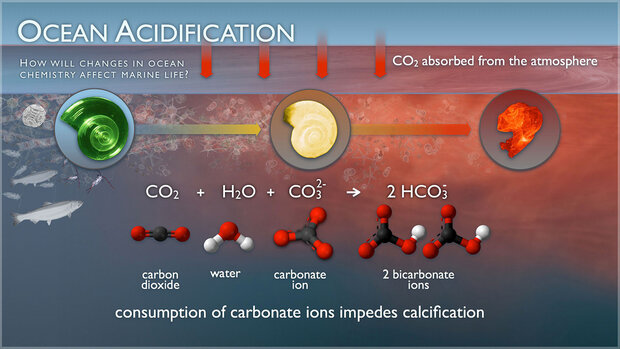
Ocean absorption of carbon dioxide reduces its abundance in the atmosphere, which helps slow the rate of global warming. But, this absorption increases the acidity of seawater (ocean acidification), endangering marine organisms and harming ocean ecosystems.
Read more at NOAA Fisheries
Read more at NOAA Ocean Acidification Program
Related articles
- Highlights from State of the Climate 2022
- What is ocean acidification?
- Current ocean acidification projects
- Coral reefs in Florida
- Ocean temperatures
- Coral reef watch
- Florida reefs and ocean acidification
- How the oceans absorb carbon dioxide is critical for predicting climate change
- Ocean acidification: The other carbon dioxide problem
- How the oceans store CO2 is critical for understanding the global carbon cycle
- Dynamic and complex carbon cycles in coastal oceans
- Oceanic measurements of carbon dioxide continue to decrease, as reported in this year's ocean carbon data atlas
- NOAA OAP, GOMO fund $3M for Optimizing Ocean carbon Observing
- Biden-Harris Administration invests $2.1 million for measuring surface ocean carbon through the Investing in America agenda
