May 2017 ENSO Update: Mayday
We’re finally starting to get through the spring barrier, when climate models have a harder time making successful forecasts. Forecasters estimate the chance of El Niño forming is about equal to the chance that neutral conditions will continue: both are just shy of 50% through the fall. Unlike two years ago, when the signal that a strong El Niño was developing was clear, most of our prediction tools are suggesting very borderline conditions, making it a tough forecast.
Current events
Ocean temperatures in the Niño3.4 region have been in neutral territory for a few months now, shifting from slightly cooler than the long-term average to about 0.4°C (0.7°F) warmer than average during April in one of our SST datasets.
The “coastal El Niño” that we’ve been watching (much warmer than average sea surface temperatures near the tropical coast of South America) has weakened substantially over the past couple months, to about 0.9°C above average during April. This ocean warming is very significant for Peru and Ecuador, since it can lead to rising moist air and cause thunderstorms over the coastal regions. However, the coastal El Niño doesn’t always precede the kind of El Niño that we forecast here at the blog, so it is limited as a predictive tool. (Check out the second half of Tony’s post for more information.)
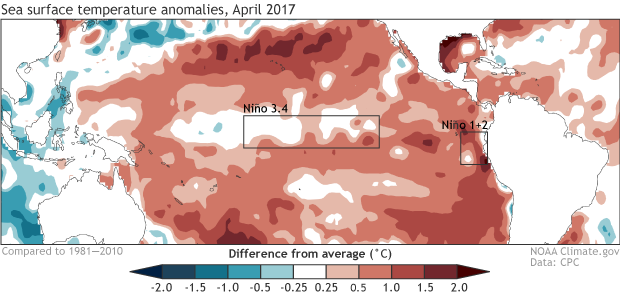
Average sea surface temperature during April 2017, shown as departure from the long-term (1981-2010) average. Climate.gov figure from CPC data.
Since the start of the great La Niña of 2016-17 (I’m kidding, it was measly), the atmosphere in the tropics has shown signs of a stronger-than-average Walker circulation, with more rain over Indonesia, less over the central Pacific, and stronger near-surface east-to-west winds along the equator. This is expected during La Niña, but these atmospheric conditions outlasted the cool ocean conditions by a few extra months. However, during April, this pattern finally dissipated, and the atmosphere finally looked bona fide neutral.
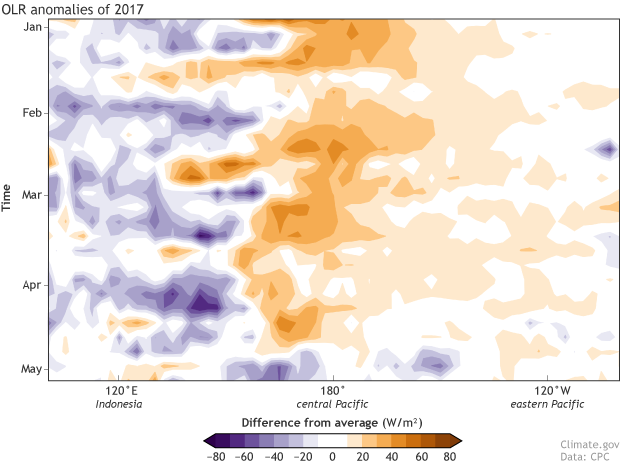
Time-longitude graph showing the changes in cloudiness over the past 5 months. Graph shows conditions over the Equator in January 2017 (top) through May 2017. Purple indicates more clouds than the long-term average and orange fewer; the persistent La Niña pattern of less cloudiness in the central Pacific changes in late April. Long-term average is from 1981-2010. Data based on satellite observations of outgoing longwave radiation (heat). Thick clouds block heat from radiating out to space, so less radiation = more clouds, and more radiation = clearer skies.
Coming attractions
So, here’s the tricky part. As regular readers know, we not only need to expect that El Niño conditions will develop (with the sea surface temperature in the Niño3.4 region more than 0.5°C warmer than average) but also that they will stay there for several months to qualify as an El Niño episode. The reasoning behind that requirement is to be sure we’re seeing a more persistent seasonal event, rather than other weather and subseasonal fluctuations.
Many of the forecast models are predicting that sea surface temperatures in the Niño3.4 region will hover around 0.5°C warmer than average for several months. Some of the models are a little warmer, some a little cooler. The average of the models, which is generally considered to be the best forecast, is very close to 0.5°C above average, continuing along through the summer and into the fall.
With the forecast falling right on the threshold, the outcome could be several seasons in a row greater than 0.5°C… or it could be a slightly cooler outcome, leaving us coasting in neutral. Right now, there are not a lot of indications one way or the other.
Along with the range of potential outcomes shown by the computer models, we pay close attention to the amount of extra heat under the surface of the tropical Pacific Ocean. This subsurface temperature often leads the surface temperature by a few months, so if we saw a larger amount of warm water under the surface it could provide some confidence to shore up the models that are forecasting El Niño. Currently, temperatures are only slightly elevated, and there hasn’t been a strong warming over the past few months.
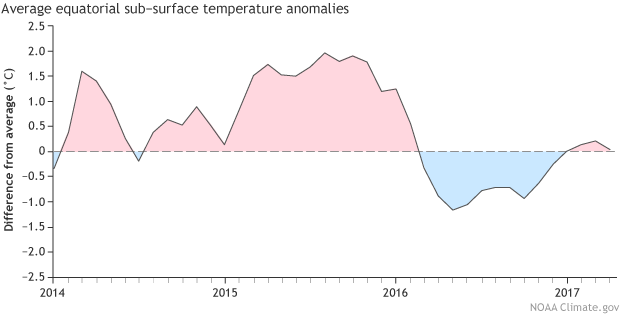
Monthly average heat content in the upper 300m of the equatorial Pacific. Data shown is the difference from the 1981-2010 average between 180°W and 100°W. Climate.gov graphic from CPC data.
With the forecast balanced between El Niño and continued neutral conditions, we’ll have to make sure we load up on the popcorn and soda, turn off our cell phones, and watch the movie...whoops, I mean, activity in the tropical Pacific...closely over the next few months.
Comments
Blobs north vs. south
ENSO model
Onset of Discharge
RE: Onset of Discharge
Most climate models are coupled to an ocean model, so I'd be interested in whether these dynamics reproduce themselves in the models that the ENSO forecast team already considers. Just so we're clear, what index are you looking at to define the onset of discharge? (region, dataset, etc)
We did see evidence of discharging near the peak of the El Nino in 2015-16... something we wrote about here... but this may not be precisely what you're referring to because I see in your paper you're referring to lead times up to 18 months.
https://www.climate.gov/news-features/blogs/enso/life-and-death-el-niño
Ultimately, we had a weak (barely there) La Nina during 2016-17 via our ONI index.
Thanks for your input!
Wet Spring in NE and Eastern Canada
Comments have been disabled on this article