ENSO Blog
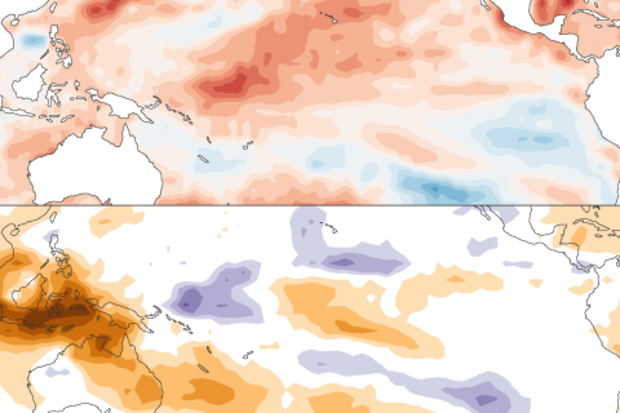
I want to kick off this blog post by introducing you to a force of nature in the climate community, Geert Jan van Oldenborgh. He just got recognized by the European Meteorological Society with a Technology Achievement Award for building the KNMI Climate Explorer. This website, which you can access at https://climexp.knmi.nl/, is a great way to plot and play with climate data. Give it a whirl!
Geert Jan isn’t just a talented web programmer and data manager—he is also a prolific climate scientist who has been working with me and several of our colleagues on a matter of increasing importance. Our collaborators include the Bureau of Meteorology in Aust…
Read article
La Niña is hanging on in the tropical Pacific, but it’s likely a transition to neutral will occur in the next month or so, and the chance of neutral goes up to 80% in May–July. Grab your goggles and your running shoes! We’re going to get some exercise today.
Swim
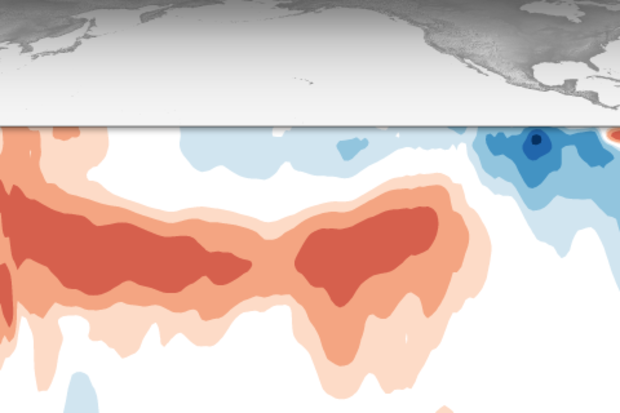
The monthly average sea surface temperature in the Niño 3.4 monitoring region increased from February to March, with March coming in about 0.8°C below the long-term average according to the ERSSTv5 dataset. (Long-term = 1991–2020.)
The January–March average was 0.9° cooler than average, marking our seventh consecutive season of La Niña conditions. We use “season” to describe any three-month-average period, not just wint…
Read article
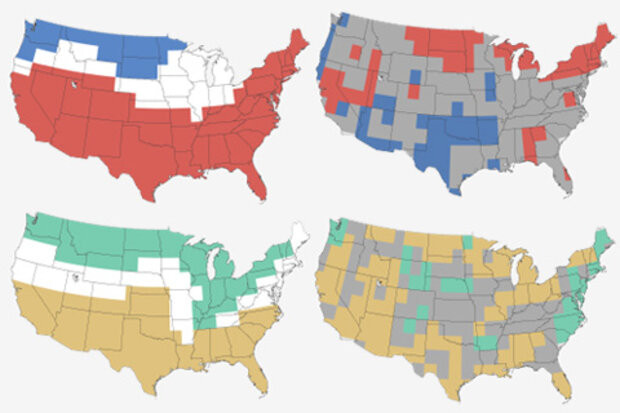
Ah, spring. Flowers blooming, birds chirping, engrossing ENSO Blog articles verifying the winter outlook. What’s not to like?! So let’s look back at the Climate Prediction Center’s Winter Outlook for 2020-2021 and take a nuanced look at how seasonal outlooks are made.
MATH ALERT! MATH ALERT! (*sirens blaring*) Verification (assessing the extent to which a forecast “came true”) requires some basic statistical knowledge. Head to one of six ENSO Blog posts I’ve written on the topic of forecast verification (yes, six! I’m a big nerd) to dig deeper into the nitty gritty.
For a TL;DR version, a reminder that scientists assign a percent chance that seasonal average temperatures and total prec…
Read article
La Niña continues in the tropical Pacific, but it has weakened recently, and forecasters estimate about a 60% chance of a transition to neutral conditions in the late spring. Looking farther out into the fall of 2021, El Niño is unlikely to develop, and the chances of La Niña and neutral are similar.
Migratory birds
The February 2021 average sea surface temperature in the Niño3.4 region—our primary ENSO monitoring index—was just about the same as January, at about 1.0°C cooler than the 1991–2020 average, according to the ERSSTv5 dataset. (ICYMI: I covered the shift to the 1991–2020 average last month.) This comfortably exceeds the La Niña threshold of 0.5°C cooler than average.
…
Read article
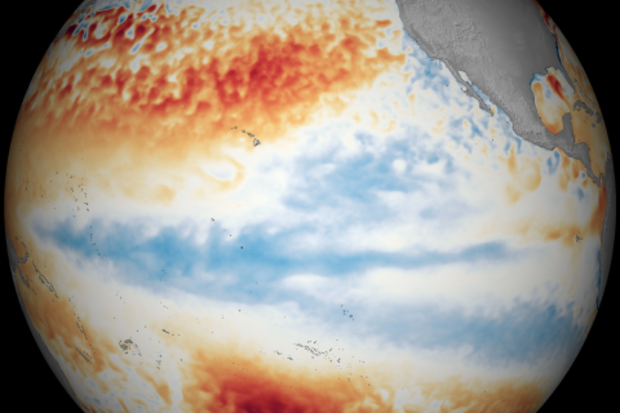
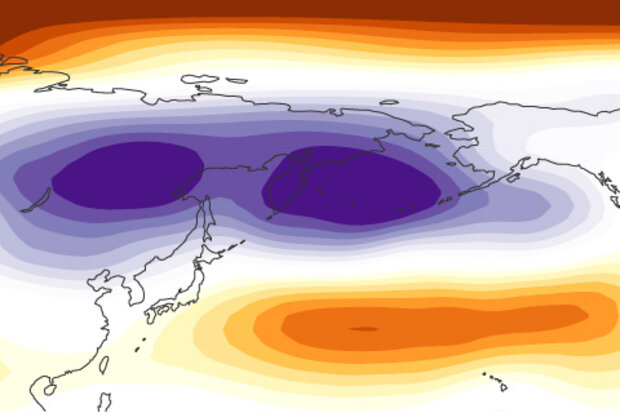
We are rapidly approaching the end of the meteorological winter, and it has been quite a finish for much of the United States, especially for those who have suffered the devastating effects of recent extreme cold. As discussed on this blog, we have been in the grips of a healthy La Niña, but the weather outside of the tropics often hasn’t behaved as we would expect for La Niña, even before this period of extreme cold and winter storms. In this post, we’ll investigate what was going on for the first two-thirds of this winter.
Feeling the pressure
As Emily mentioned back in January, the early winter temperature pattern over North America looked more like a typical El Niño than what we wo…
Read article
