Predicting the chances of a polar vortex disruption this winter
When we launched this blog last winter, the atmosphere came through for us with not one, but two breakdowns of the stratospheric polar vortex. That was very considerate of it, given that many winters pass without even a single one. With all the excitement that occurs when the stratospheric polar vortex is disrupted during a sudden stratospheric warming, our readers might wonder whether there is any way to predict weeks or even months ahead of time the likelihood that one (or more!) will occur this upcoming winter.
As we discussed last year, there are certain ingredients that need to come together to drive a sudden stratospheric warming. These can be boiled down to two main factors:
- persistent weather patterns in the lower atmosphere (troposphere) that can amplify large-scale atmospheric waves vertically into the stratosphere; and
- ideal wind conditions in the stratosphere that steer the arriving waves and encourage them to break near the polar vortex, which rapidly slows the polar stratospheric winds.
The exact details of these factors are often not predictable beyond 7-10 days [footnote 1], but that doesn’t mean we can’t say anything about the likelihood of a polar vortex disruption and sudden warming happening in a given season. That’s because there are ocean and atmospheric climate patterns or oscillations that are potentially predictable weeks or months ahead of time, and these predictable climate patterns can influence the ingredients for a sudden stratospheric warming listed above. In other words, while we can’t predict the exact timing of a sudden warming months ahead of time, we might be able to give the odds (make a “probabilistic forecast”) that one is likely (or not) to occur at some point during the winter, based on how we think these other climate patterns will affect our sudden stratospheric warming recipe.
Playing the odds: things that increase or decrease the chances of polar vortex disruptions & sudden stratospheric warmings
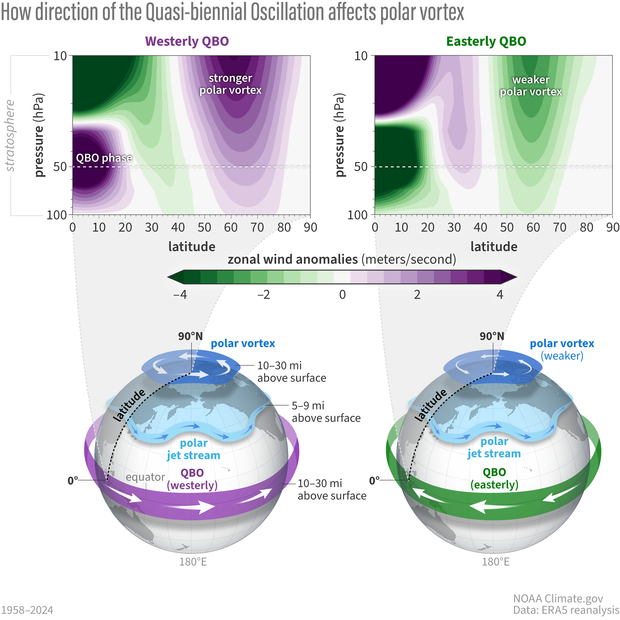
We know that El Niño-Southern Oscillation (ENSO) drives “teleconnections” – predictable patterns of high and low pressure that extend from the tropics into the mid-latitudes. These highs and lows represent large-scale atmospheric waves, which can be used to predict remote weather impacts. As Amy wrote about in a guest post on the ENSO blog a few years ago, these ENSO-related atmospheric waves can help to amplify–or dampen–normal high and low pressure patterns in the mid-latitudes, and that interaction affects whether these waves get big enough to travel into the stratosphere. On average, El Niño teleconnections tend to amplify more waves into the stratosphere, and those waves weaken wintertime polar vortex winds on average compared to La Niña (see the image below, left side). There’s a ~30% increase in sudden stratospheric warmings during El Niño winters [footnote 2; Polvani et al. 2017].
Changing the amount of atmospheric waves coming up from the troposphere is one way to change the likelihood of a polar vortex disruption/sudden warming. Another way is to change where the waves break once they get to the stratosphere. If they’re forced to break near the pole, a disruption and sudden warming of the polar vortex becomes more likely. If they’re forced to break farther south, the polar vortex is more likely to remain undisturbed. So what determines where they break?
Remember that large atmospheric waves can only travel in winds that blow from the west. That’s the direction the stratospheric winds blow in most of the polar to middle latitudes during winter, allowing waves to travel freely there. But farther south, the Quasi-biennial Oscillation (or QBO) comes into play.
(left) When the Quasi-biennial Oscillation (QBO) is from the west, winter (Dec-Jan) polar stratospheric winds are stronger than average (purple), making sudden stratospheric warming less likely. (right) When the QBO is from the east, the polar vortex is weaker than average (green). The panels above the globes show difference from average east-west winds at altitudes from 100 to 10 hPA across each latitude band from the equator (zero) to the North Pole (90). The dashed line indicates the altitude/pressure level used to define the QBO. Positive values mean westerly winds at a given latitude and altitude were stronger than average; negative values mean weaker-than-average westerlies (or stronger-than-average easterlies). Data is from the ERA5 reanalysis, and the anomalies are defined relative to the 1991-2020 average. NOAA Climate.gov image, adapted from analysis by Amy Butler.
The QBO describes an approximately 2-year (or, “quasi-biennial”) cycle of alternating easterly (from the east) and westerly (from the west) winds in the tropical stratosphere. This flip-flop of tropical winds can either allow waves in the stratosphere to keep traveling into the subtropical regions (if the QBO winds are blowing from the west) or force them to break closer to the pole (if the QBO winds are blowing from the east). [footnote 3]
This is one explanation for why we see weaker polar vortex winds and increased chances of sudden warmings during “easterly QBO” and stronger polar vortex winds and reduced chances of sudden warmings during “westerly QBO”.
Reading tea leaves for the polar vortex in winter 2024-25
So far we've talked about the relationships between the polar vortex and the QBO and ENSO separately, but both phenomena are often occurring at the same time [footnote 4]. If we combine these statistical connections, it can help us predict whether a sudden stratospheric warming (SSW) [footnote 5] might be more or less likely to occur this winter.
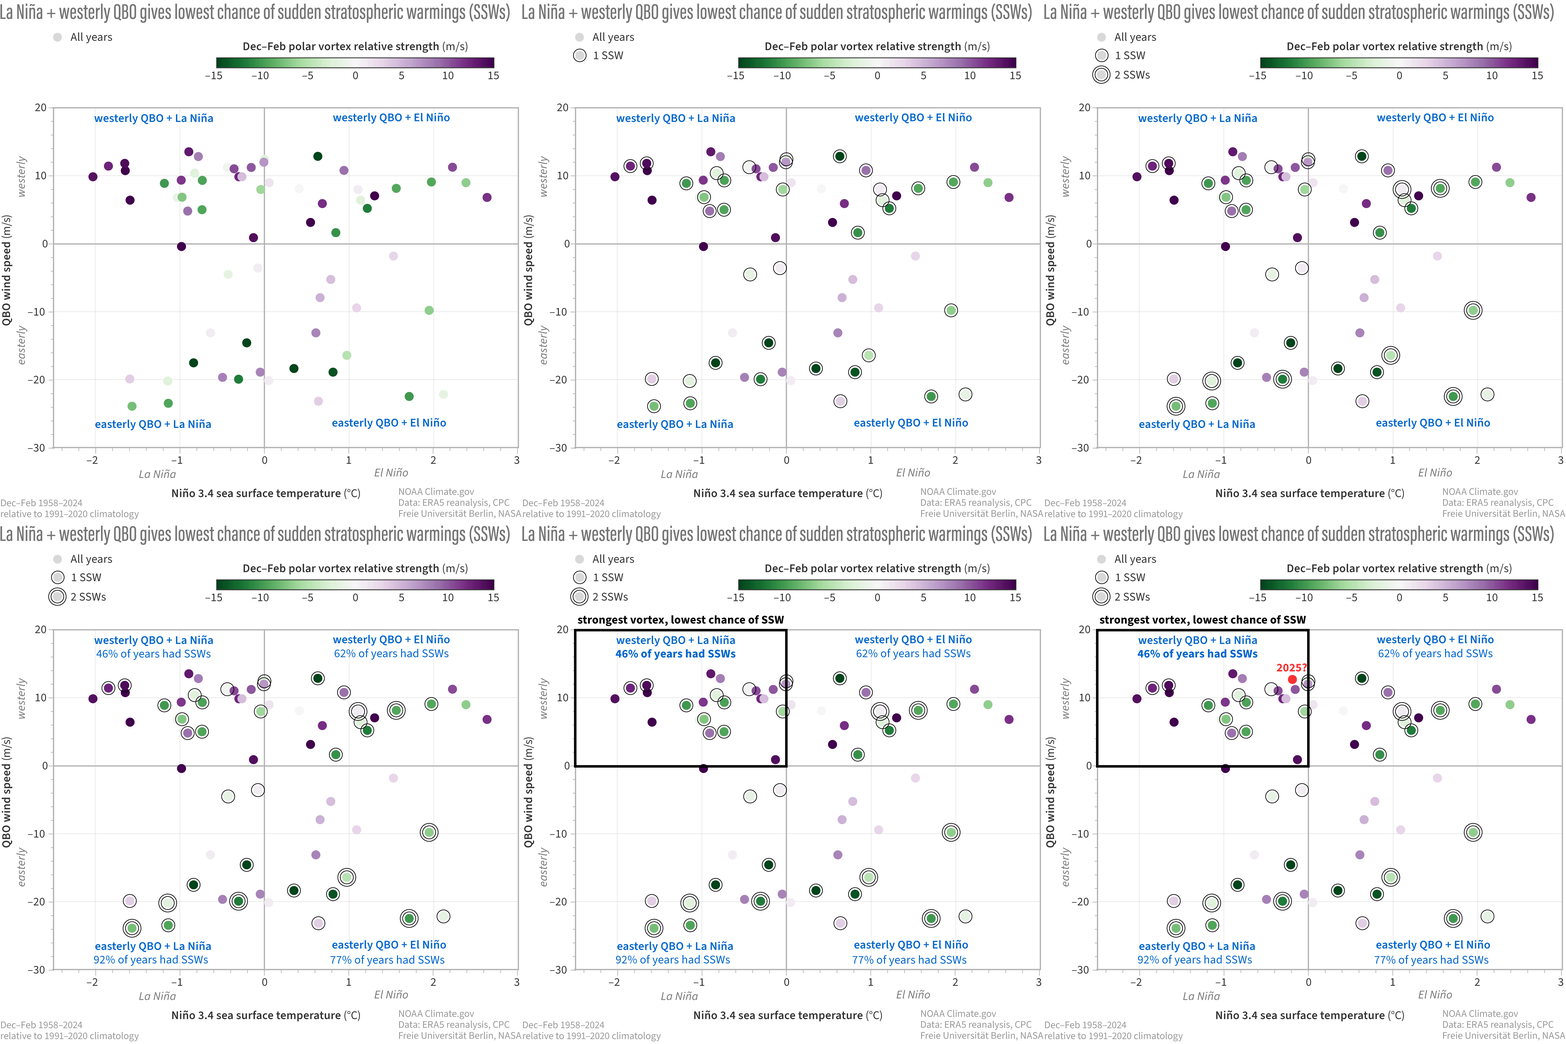
If we sort past winters by their ENSO and QBO status, what we find is that the state of ENSO and QBO in early winter can be used to give some indication of the overall seasonal strength of the polar vortex and the likelihood of a SSW. That’s what you can see in the image below.
The dots in each quadrant of this graph show the strength of the polar vortex in past winters (December-February), based on the phase of the Quasi-biennial Oscillation (QBO) (vertical axis: positive values indicate westerly winds, negative values indicate easterly winds) and tropical sea surface temperatures in the Nino 3.4 region (horizontal axis: positive values indicate El Niño-like conditions, and negative values indicate La Niña-like conditions). The strongest polar vortex years (dark purple dots) cluster in the upper left quadrant of the graph, meaning winters with westerly QBO and La Nina. The weakest polar vortex years (dark green dots) occur in easterly QBO winters. Winters with at least one polar vortex disruption/sudden stratospheric warming (SSW) are marked with a black outline (and years with two have two circles). The red dot indicates where winter 2025 would rank based on November 2024 values only. NOAA Climate.gov image, adapted from original by Amy Butler.
For example, most of the dark purple dots indicating a very strong polar vortex year occur in the upper left quadrant of the image, which are winters with La Niña and westerly QBO conditions. And unsurprisingly, these are also the conditions with the lowest occurrence of SSWs (46% of winters with these conditions have had a SSW). On the other hand, the winters with the highest occurrence of SSWs occur during easterly QBO winters in general (the bottom half of the plot), but during La Niña conditions in particular (the lower left quadrant). This is somewhat surprising, since if we just consider ENSO conditions, La Niña is actually associated with stronger polar vortex winds over a season. This may mean there could be some interactions that occur between ENSO and the QBO that promote SSWs in unexpected ways, or non-linear interactions of ENSO with the polar vortex [footnote 2].
What does this tell about this upcoming winter? Using November 2024 values for the QBO and ENSO, the winter of 2024-2025 looks likely to fall into westerly QBO and La Niña conditions (upper left quadrant). This would suggest that chances for a SSW are somewhat reduced compared to average, and conditions may even be primed for a strong polar vortex. Nonetheless, sudden warmings have occurred in these conditions before (12 times!)- which again re-emphasizes that these sorts of statistics can only tell us probabilities. Even though there’s a 55% chance an SSW won’t happen, there’s still a 45% that a SSW could occur. In other words, don’t bet the farm on this year’s odds for a SSW.
What does the crystal ball say?
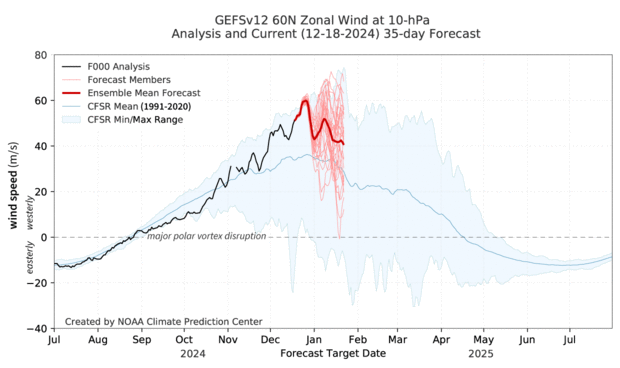
So what do the most recent forecasts tell us? Over the last two weeks, polar vortex winds have been extremely strong, with extended range forecasts showing little chance of a slowdown through at least the beginning of January. As for what our quick statistical analysis might tell us if it were a Magic 8 ball, to the question if stronger-than-average polar vortex winds will continue: “Signs point to yes” [footnote 6].
Fig 3. Observed and forecasted (NOAA GEFSv12) wind speed in the polar stratosphere compared to the natural range of variability (faint blue shading). For the GEFSv12 forecast issued on 18 December 2024, the winds at 60 degrees North (the mean location of the polar vortex) are forecast to remain stronger than normal for at least the next 2 weeks (bold red line). By mid-January, the forecasted strength of the polar stratospheric winds becomes very uncertain (light red lines). NOAA Climate.gov image, adapted from original by Laura Ciasto.
Footnotes
- If we want to predict the exact timing and details of if and how a sudden stratospheric warming will evolve, it’s likely to be about as successful as a 7-10 day weather forecast- because the ingredients that drive these disruptions are related to and affected by weather patterns that are only predictable that far ahead of time. However, note that once a sudden warming occurs, it has potentially predictable impacts on surface climate for weeks to months afterwards.
- The two phases of ENSO, El Niño and La Niña, have roughly opposite-signed high and low pressure teleconnections. For example, over the North Pacific, El Niño teleconnections are typically associated with a deepening of the Aleutian Low, while La Niña teleconnections weaken this low pressure region. This might make you think that the two phases of ENSO should also induce opposite-signed responses in the occurrence of sudden warmings. However, in the ~65 year observational record, sudden warmings occur more often in both El Niño and La Niña winters compared to ENSO-neutral conditions (Butler and Polvani 2011). So, what’s going on? It’s possible that La Niña teleconnections may be able to amplify atmospheric waves in a different way than El Niño (i.e., not over the North Pacific, but in one of the other regions of high/low pressure). Alternatively, it’s possible that 65 years isn’t actually enough to get an accurate measure of this relationship, and so the observed increase in sudden warmings during La Niña is just random luck. When long climate model simulations are performed, in general they see fewer sudden warmings during La Niña than El Niño (Polvani et al 2017). However, these models might also not capture ENSO teleconnections and their effect on the stratosphere correctly.
- In a future blog post, we will go into more detail about the QBO and why it occurs, and how it affects the polar vortex. The explanation presented here is the most common one and was described by Holton and Tan (1980). But it’s not clear that this fully explains the connection between the tropical and polar stratospheric winds (Garfinkel et al 2012).
- There are also many other persistent climate patterns that have been used to look for these statistical connections and guide seasonal forecasts of the polar vortex and sudden stratospheric warmings, including the Madden-Julian Oscillation, Arctic sea ice, Eurasian snow cover, North Pacific sea surface temperatures, or winds in the upper stratosphere.
- After intense negotiation, our editor agreed to allow us to introduce the acronym SSW mid-way through the post, on the assumption that by this point, readers would be as tired of reading it spelled out as we were.
- This Magic 8 ball response is likely too confident, but we couldn't find a Magic 8 ball response that said "More likely yes than no but not by much".
Data
The ENSO index uses ERSSTv5 sea surface temperature data in the Nino 3.4 region, and can be found on the NOAA Climate Prediction Center website.
The QBO index uses daily zonal winds measured from radiosondes (balloons) at three tropical stations: Canton Island, Gan/Maledive Islands, and Singapore. Since 1975, the data is only based on measurements from Singapore. The data was compiled by the Freie Universitat Berlin. However since this data stopped updating in 2021, here we supplement from 2021-2024 using Singapore station data from the NASA QBO website.
References
Butler, A. H., and L. M. Polvani (2011), El Niño, La Niña, and stratospheric sudden warmings: A reevaluation in light of the observational record, Geophys. Res. Lett., 38, L13807, doi:10.1029/2011GL048084.
Garfinkel, C. I., T. A. Shaw, D. L. Hartmann, and D. W. Waugh, 2012: Does the Holton–Tan Mechanism Explain How the Quasi-Biennial Oscillation Modulates the Arctic Polar Vortex?. J. Atmos. Sci., 69, 1713–1733, https://doi.org/10.1175/JAS-D-11-0209.1.
Holton, J. R., and H. Tan, 1980: The Influence of the Equatorial Quasi-Biennial Oscillation on the Global Circulation at 50 mb. J. Atmos. Sci., 37, 2200–2208, https://doi.org/10.1175/1520-0469(1980)037<2200:TIOTEQ>2.0.CO;2.
Polvani, L. M., L. Sun, A. H. Butler, J. H. Richter, and C. Deser, 2017: Distinguishing Stratospheric Sudden Warmings from ENSO as Key Drivers of Wintertime Climate Variability over the North Atlantic and Eurasia. J. Climate, 30, 1959–1969, https://doi.org/10.1175/JCLI-D-16-0277.1.


Comments
Where's My Comment?
we've left comments here in the recent past but for some reason they do not appear. is there a reason for not publishing out comments?
Re: where's my comment?
Comments on our blogs have always gone through moderation before publication; we're just quicker sometimes than others, based on work load, level of spam we have to wade through first, holidays, etc.
Add new comment