Blogs
The recent bushfires in Australia have left a trail of destruction, gripping the world with infernal images of widespread devastation. The catastrophic bushfire season resulted from extremely hot and dry weather in spring and early summer throughout the country. As is usually the case, such extreme conditions involve several factors working together, including human-caused global warming as well as naturally occurring weather and climate patterns.
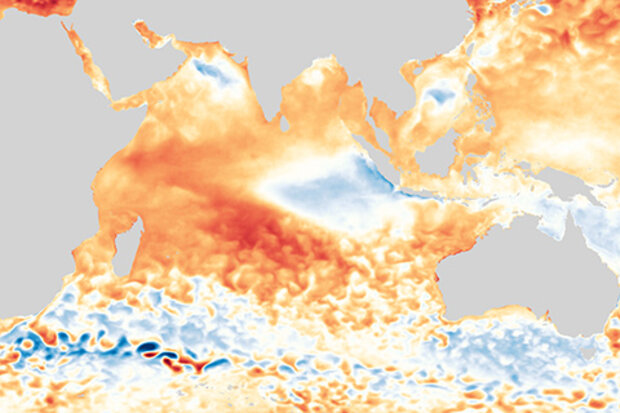
One of those important factors was an extreme Indian Ocean Dipole (IOD) event, a phenomenon we have mentioned previously but not in depth. If you were hoping for a bit more background on this pattern, then you’ve come to the right place!
New …
Read article
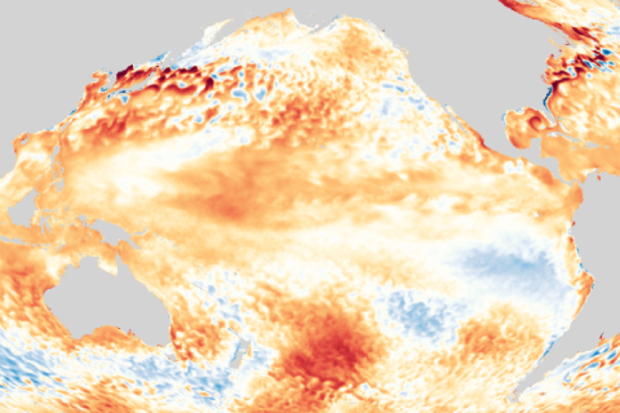
The tropical Pacific is warmer than average, but it doesn’t meet El Niño criteria. Forecasters estimate about a 60% chance that ENSO-neutral conditions will continue through the spring, with a 50% chance of neutral through the summer. (ENSO = El Niño/Southern Oscillation, the whole ocean/atmosphere El Niño/La Niña system.)
If you’ve been paying close attention to the sea surface temperatures, you may have noticed that the Oceanic Niño Index, the three-month-average temperature anomaly in the Niño3.4 region, has now been above the El Niño threshold for two consecutive three-month periods, October–December and November–January. (Anomaly = departure from the long-term average.)
The fo…
Read article
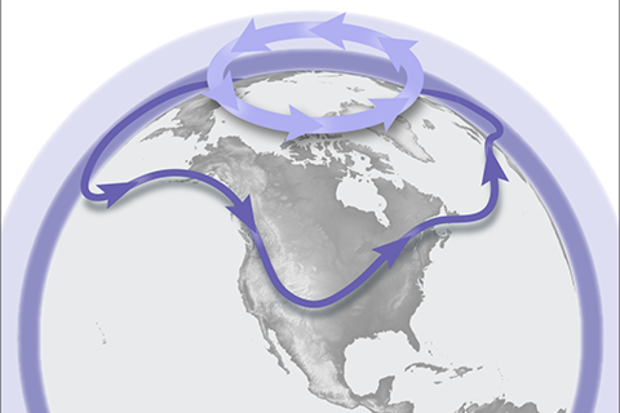
Editor's note: Jan. 12, 2021. This post from last winter is getting a lot of fresh attention thanks to its appearance somewhere in the Google news feed last week. Although the details of the state of the tropospheric and stratospheric vortexes in this post are from last year, the explanation of the basic science of these atmospheric features is still solid. Come back and visit us on January 28 for an update on the current state of the polar vortex and how the Sudden Stratospheric Warming event that happened in early January may influence mid-latitude weather in coming weeks.
Just kidding! But, oh well, you clicked and now we’re all going to go for a walk together down polar vor…
Read article
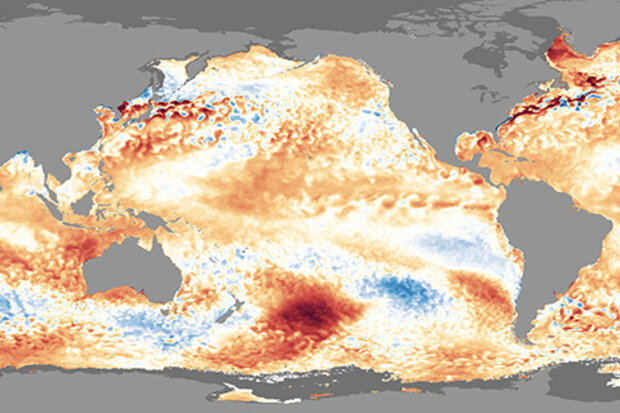
Ocean and atmosphere conditions in the tropical Pacific are ENSO-neutral, and forecasters favor neutral through the spring. Wait, don’t go! As usual, there’s a lot more to the ENSO story.
Get organized
The sea surface temperature in the Niño3.4 region in the east-central equatorial Pacific, our primary location for monitoring the El Niño-Southern Oscillation (ENSO) climate phenomenon, has been above average for a few months now. In fact, the 3-month-average (the Oceanic Niño Index) in October–December was 0.46°C above normal, which rounds to 0.5°C. “Hey!” you say. “Isn’t that the El Niño threshold?” Indeed it is, but of course El Niño requires more than a couple months of above-average…
Read article
NOAA’s National Centers for Environmental Information (NCEI) tracks U.S. weather and climate events that have great economic and societal impacts (www.ncdc.noaa.gov/billions). Since 1980, the U.S. has sustained 258* weather and climate disasters where the overall damage costs reached or exceeded $1 billion (including adjustments based on the Consumer Price Index, as of January 2020). The cumulative cost for these 258 events exceeds $1.75 trillion.
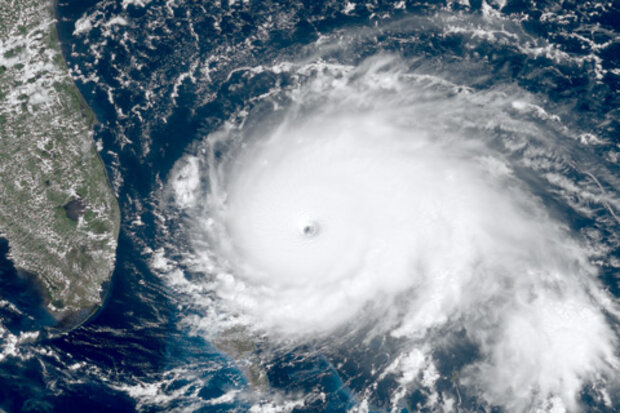
During 2019, the U.S. experienced a very active year of weather and climate disasters. In total, the U.S. was impacted by 14 separate billion-dollar disasters including: 3 major inland floods, 8 severe storms, 2 tropical cyclones (Dorian an…
Read article
