Blogs
The great La Niña of 2017–18 is dwindling, and forecasters expect the return of neutral conditions by the March–May season, estimated at about 55% likelihood. Neutral conditions are favored to continue through the summer. It’s too early to get a picture of next fall and winter, due to the spring predictability barrier and the absence of strong signs one way or the other. There are a few interesting features we’ll watch closely over the next few months… but first, this update on current conditions!
Stick your toe in
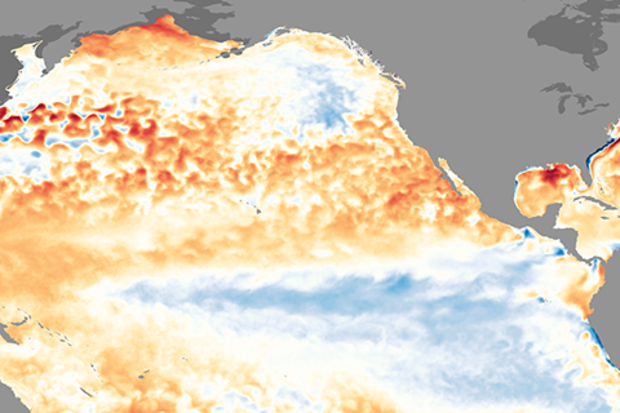
La Niña may be weakening, but she’s still making an impression on the average sea surface temperature in the equatorial Pacific. The Niño3.4 index, which measures the depart…
Read article
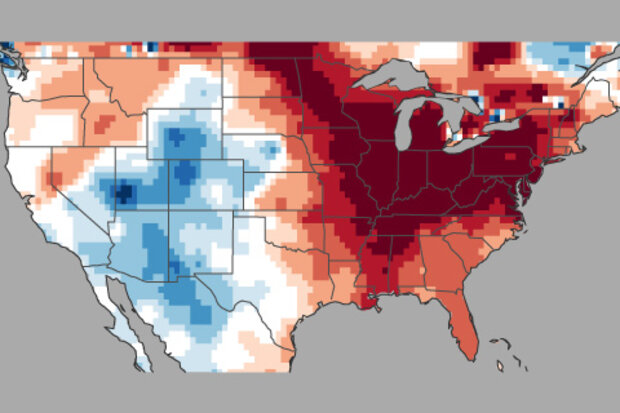
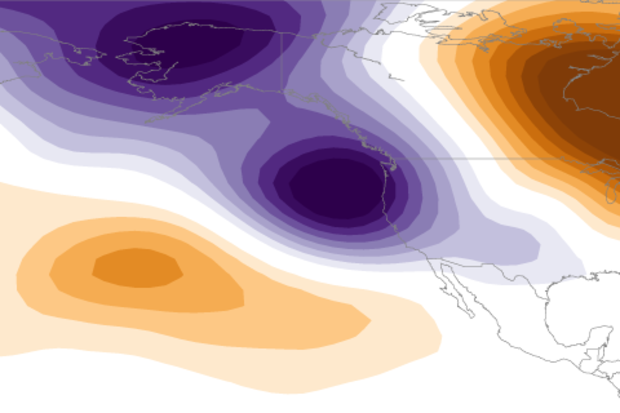
Howdy readers! It’s now mid-February and while some of us are still dealing with the last vestiges of deep winter (wrapped up in wool blankets, sipping our hot tea, in the glare of our light therapy lamps), I thought it would be a nice time to recap what we’ve seen weather- and climate-wise so far this winter. Official winter for us meteorologists is the months of December-February, and although we’re not quite done, I still want to point out the changes in surface temperature over the U.S. so far because they’ve been really fascinating, likely in part due to the Madden-Julian Oscillation or “MJO.”
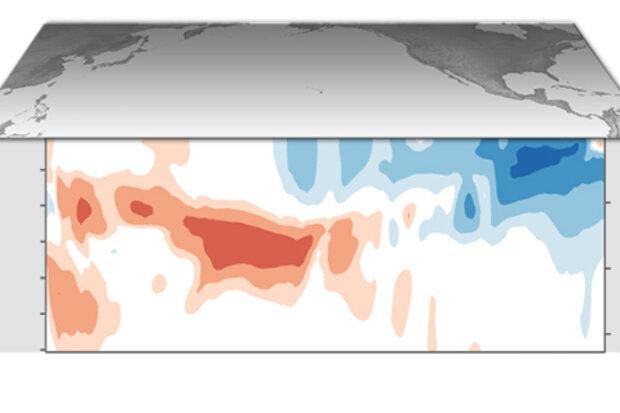
Wheel o’ MJO
The What? The MJO? This can’t be good! But please hang tight—he…
Read article
Many thanks to Tom for covering my post last month, allowing me to focus on the American Meteorological Society’s annual meeting (where I talked about the blog, and enjoyed my company on the plane ride home). It’s good to be back, and I’m glad to see our La Niña is still hanging around… although probably not for much longer. In fact, the current ENSO forecast from the Climate Prediction Center and IRI predicts a 55% chance that neutral conditions will be in place by spring 2018. Let’s get to it!
Sea shanties
During January, the sea surface temperature in the Niño3.4 region of the tropical Pacific—our primary measurement for ENSO’s ocean component—was close to 1.0°C cooler than the long…
Read article
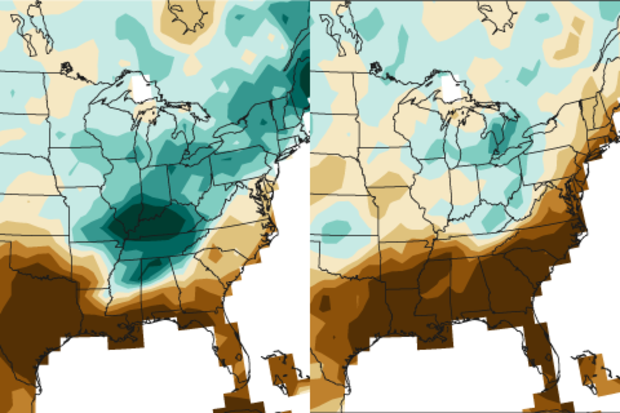
Currently, we are fully immersed in the second winter of a “double-dip” La Niña. Although it will take some time before we can see how this event stacked up with past events, you might have noticed that it has been quite dry over much of the U.S. this winter, with drought expanding across several regions, particularly in the south. Being the big ENSO fans that you are, you might have asked yourself, are these conditions typical in the second winter of a double-dip La Niña? And are there any differences in how the atmosphere responds to La Niña in the second winter relative to the first? Well if either of those questions ever crossed your mind, then you’re i…
Read article
* {
margin: 0;
padding: 0;
}
.media-image_one {
height: 350px !important;
}
.media-image_two {
height: 680px !important;
}
#page-wrap {
width: 620px;
margin-left: 0px;
position: relative;
}
a {
text-decoration: none;
color: black;
}
.image-link {
display: block;
width: 620px;
height: 320px;
position: absolute;
top: -360px;
left: 0px;
}
.image-link_two {
display: block;
width: 620px;
height: 650px;
position: absolute;
top: -680px;
left: 0px;
}
#one {
background: url(/sites/default/files/Sacramento_cummulative_precip_linegraph_620.jpg) no-repeat;
z-index: 5;
}
#two {
background: url(/sites/default/files…
Read article