Blogs
In the last few weeks, my colleague Karin Gleason and her colleagues around the country finalized a number of state climate extremes records and reports. Some of these were recent record-breaking events; some were recently discovered as data continue to be liberated from paper into the digital world; and some were backlogged because somebody had let them linger too long (here’s where I blush and stare at my shoes).
Here’s what Karin and Friends determined in the last month or so:
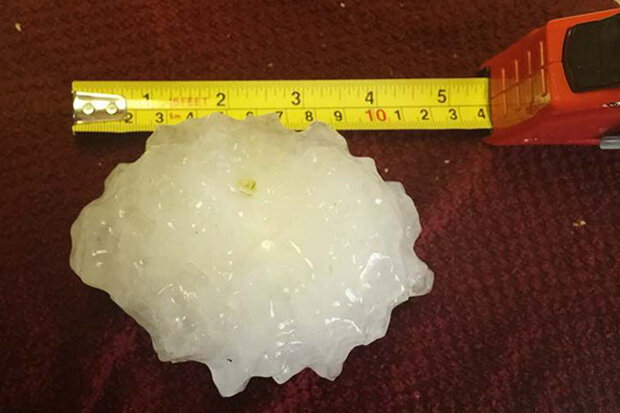
The 4.75” diameter hailstone that fell in Minooka, Illinois, in June 2015 was indeed the largest retrieved and reported in the Illinois record.
The 199 mph wind gust observed on Ward Peak in Febr…
Read article
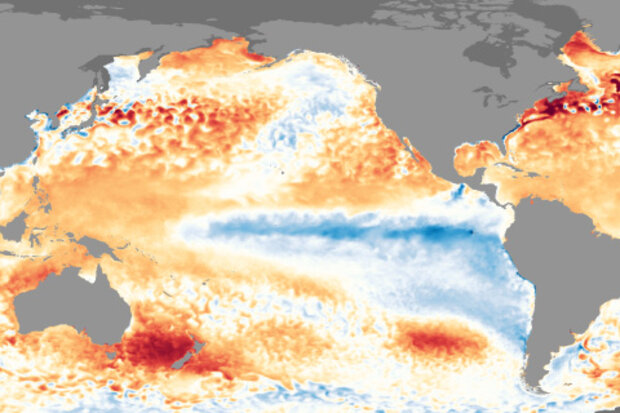
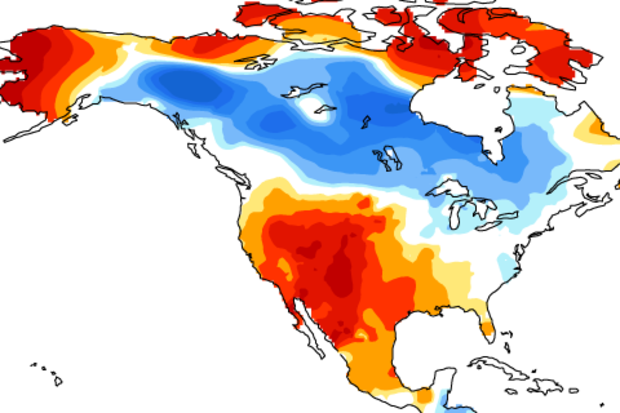
Now that we are smack dab in the middle of winter in the Northern Hemisphere, the time of year when ENSO tends to have its more reliable impacts in the United States, it’s go-time for paying attention to what’s going on in the Pacific. And the latest CPC/IRI ENSO forecast says…[drum roll please]…La Niña is here to stay for this winter with a 85-95% probability before transitioning to ENSO-Neutral conditions during the spring.
Sidenote: Also, who is this person writing this post who is definitely not Emily? I’m Tom and I’m filling in for Emily this month (see footnote for Emily’s whereabouts). And just like a normal substitute teacher, don’t be surprised if I end this article early and jus…
Read article
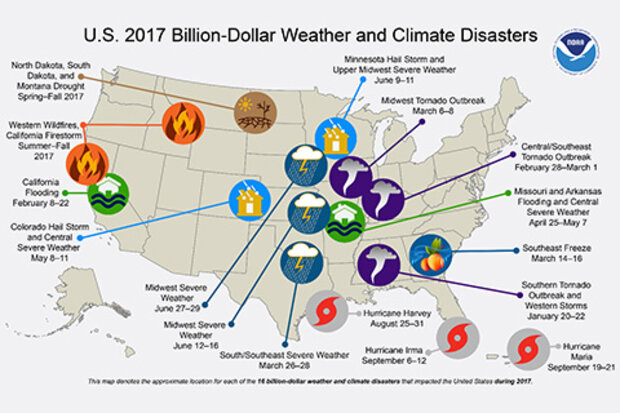
NOAA’s National Centers for Environmental Information (NCEI) tracks U.S. weather and climate events that have great economic and societal impacts (www.ncdc.noaa.gov/billions). Since 1980, the U.S. has sustained 219 weather and climate disasters where the overall damage costs reached or exceeded $1 billion (including adjustments based on the Consumer Price Index, as of December 2017). The cumulative costs for these 219 events exceed $1.5 trillion.
During 2017, the U.S. experienced a historic year of weather and climate disasters. In total, the U.S. was impacted by 16 separate billion-dollar disaster events including: three tropical cyclones, eight severe storms, two inland floods, a …
Read article
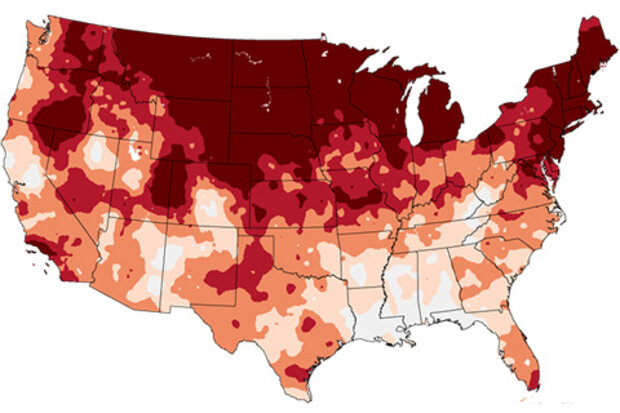
Our climate is changing and one of the most straightforward ways to understand these changes is by examining linear trends. In climate, to determine the linear trend we plot data values by when they occurred in the past and then determining a “best fit” line through that data. The slope of the line gives us the trend. Using this method we know that since 1895 the contiguous U.S. temperature has warmed at a rate of 1.45 °F per century.
However, temperatures are not warming uniformly in space or time. The cold parts of the day (nights), cold parts of the year (winter), and cold parts of the world (high latitudes) tend to be warming the fastest. To help our users understand how diff…
Read article
Our second La Niña year in a row is in full swing now, and is forecast to last through the winter. In November, the average surface water temperature in the Niño3.4 region of the central Pacific Ocean was about 1.0°C cooler than the long-term average. A “double-dip” La Niña is not uncommon—seven La Niña winters in the 1950-present historical record followed La Niña the previous winter: 1955, 1971, 1974, 1984, 1999, 2008, and 2011. In fact, two years, 1975 and 2000, were third-year La Niñas. Only four years, 1964, 1988, 1995, and 2005, were single-year La Niñas.
This graph illustrates something interesting about our current La Niña. During multi-year La Niñas, the surface temperature i…
Read article