Blogs
This is a guest post by Ken Takahashi, who is a research scientist at the Instituto Geofísico del Perú (IGP) and currently leads the national scientific committee ENFEN, which issues the official El Niño forecasts in Peru. This post does not necessarily reflect the views of IGP, ENFEN or NOAA.
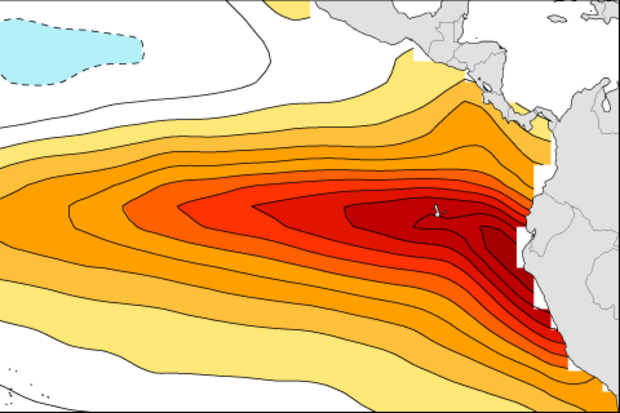
El Niño was first identified by fisherman in the late 19th century off the coasts of Peru and Ecuador (Carranza, 1892; Carrillo, 1893). Unusually high Pacific Ocean temperatures depressed the region’s fisheries, and intense rainfall led to coastal flooding. The most extreme El Niño events, in terms of the surface warming in the eastern and central Pacific, occurred during 1982-1983 and 1997-19…
Read article
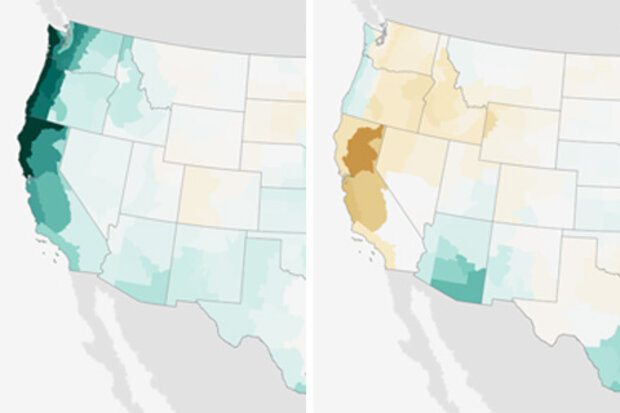
As of August, NOAA and IRI forecasters are predicting this El Niño will peak in the late fall/early winter with 3-month-average sea surface temperatures in the Niño3.4 region near or exceeding 2.0°C (3.6°F) above normal. If this forecast comes true, it will place the 2015 event among the strongest El Niños in the (admittedly short) 1950-2015 historical record. What would this mean for expected impacts in the United States?
But first, this status update!
Sea surface temperature anomalies (departures from the long-term average) increased in much of the equatorial Pacific during July. The July average in the Niño3.4 region was +1.2°C above normal according to the ERSST monitoring datasets…
Read article
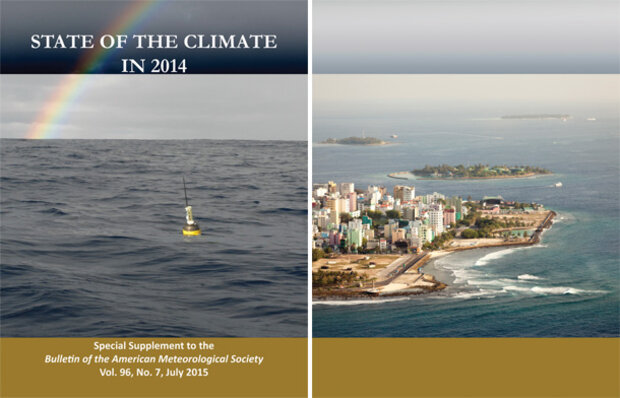
The State of the Climate is a rather huge report―in the neighborhood of 270 pages―that updates the status of major climate variables and recaps regional climate conditions around the world every year. The report just celebrated its silver anniversary: 25 years of annual publications. The first report was written by 29 scientists from 3 countries: the United States, the United Kingdom, and the former Soviet Union. Impressively, six of those scientists just celebrated their 25th anniversary of working on this report. This year, more than 400 authors and editors from 58 countries joined those original six to help bring together the State of the Climate in 2014.
We release each year’s rep…
Read article
El Niño continued to build during June, despite some shorter-term fluctuations in the climate system (here’s looking at you, MJO). CPC/IRI forecasters are still very confident that this event will persist through the winter, and they continue to favor a strong event, with the three-month average sea surface temperature in the Niño3.4 region expected to peak at more than 1.5°C above normal.
Nearly all the computer models are in agreement, and the atmosphere and ocean continued to behave in a very El Niño-like manner. So what is there to talk about this month? Well, a few interesting things happened over the past few weeks.
First, a quick rundown of where we find ourselves in the beginni…
Read article
“El Niño is Strong!”
“No, it’s Moderate!”
“But the [insert your favorite ENSO indicator here]
is the largest it’s been since the El Niño of 1997-98!”
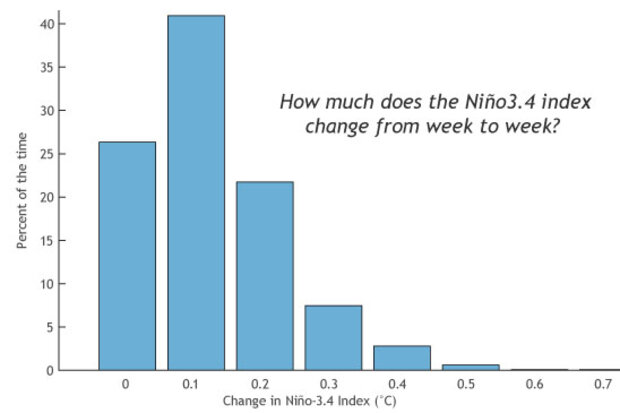
We are now nearing 1.5 degrees Celsius in the Niño-3.4 index for a 7-day or weekly average. Among the post-college age crowd who can remember it (yes, this officially means you’re old), the level of warmth in sea surface temperatures this time of year harkens back to 1997-98 El Niño, which ended up becoming a record strength event.
Are these weekly numbers impressive? Yes. But when a weekly value hits 1.5°C is El Niño instantly considered strong? I’d argue no. While a short-term (daily or weekly) number might be striking, i…
Read article


