What are teleconnections? Connecting Earth's climate patterns via global information superhighways
This is a guest post by Breanna Zavadoff and Marybeth Arcodia. Dr. Zavadoff is an Assistant Scientist at the University of Miami Cooperative Institute for Marine and Atmospheric Studies. Her current research focuses on U.S. West Coast atmospheric rivers as well as subseasonal Madden-Julian Oscillation predictability. Dr. Arcodia is a Postdoctoral Researcher at Colorado State University working in the Barnes Group. Her current research explores sources of climate predictability from subseasonal to decadal timescales using explainable artificial intelligence techniques. She also writes for the Seasoned Chaos blog, a subseasonal to seasonal forecasting blog for scientists and non-scientists alike. The blog was created by five graduate students and features posts on atmospheric and climate phenomena described in fun and digestible ways (some linked in this post), including quality graphics and even some code!
When looking at the forecast on your favorite weather app, it may be hard to imagine that forecast could be connected to atmospheric and ocean conditions all the way across the globe. Fortunately for us, these connections can allow us to make predictions weeks to months in advance. How is this possible?
Buckle up! It’s time to go for a ride on our planet’s information superhighway.
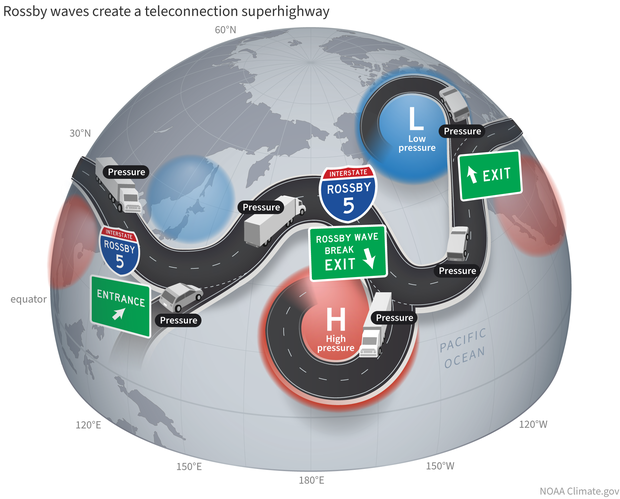
When the jet stream interacts with an atmospheric Rossby wave, it develops crests and troughs that create alternating high (red) and low (blue) pressure zones in the upper atmosphere. These connected climate patterns—teleconnections—travel along the jet stream like vehicles on a globe-spanning highway. NOAA Climate.gov image.
What is a teleconnection?
Teleconnections are significant relationships or links between weather phenomena at widely separated locations on earth, which typically entail climate patterns that span thousands of miles. Many teleconnection patterns behave like a seesaw, with atmospheric mass/pressure shifting back and forth between two distant locations—an increase in, say, atmospheric pressure in one location results in a decrease in pressure somewhere far, far away [1]. There is even evidence of Viking settlers noticing the opposing pressure patterns between Greenland and Europe dating back to ~1000 AD, which today is referred to as the North Atlantic Oscillation (NAO) [2,3].
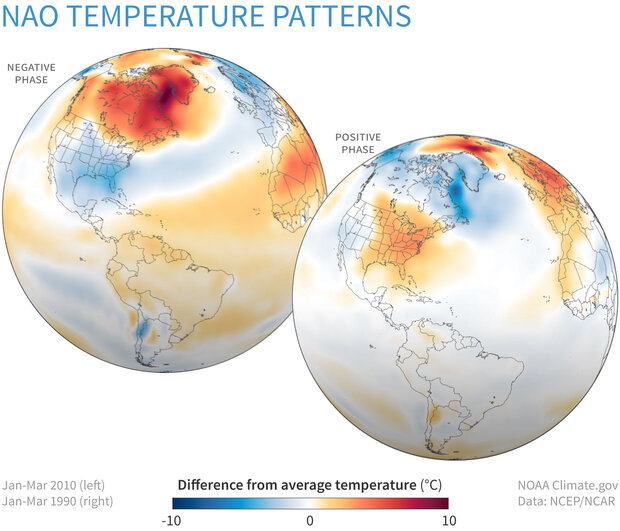
Late winter temperatures compared to the 1981-2010 average when the North Atlantic Oscillation (NAO) was strongly negative (top, Jan-March 2010) and when it was strongly positive (bottom, January-March 1990). Winters are often cooler than average across the mid-latitudes when the NAO is negative, and warmer than average when it is positive. NOAA Climate.gov image, based on data from the Physical Sciences Lab.
If you’re thinking to yourself that you’ve seen this teleconnection business before, you are absolutely right! One of the most famous drivers of teleconnection patterns is our good buddy ENSO (perhaps we are a little biased) a.k.a the El Niño/Southern Oscillation. The “Southern Oscillation” refers to changes in sea-level pressures that are centered over the eastern tropical Pacific and over Indonesia (learn more here and here). Followed closely in notoriety is the Pacific-North American pattern, an oscillatory pressure pattern over the Pacific Ocean and North America, which influences North American and European temperature and precipitation.
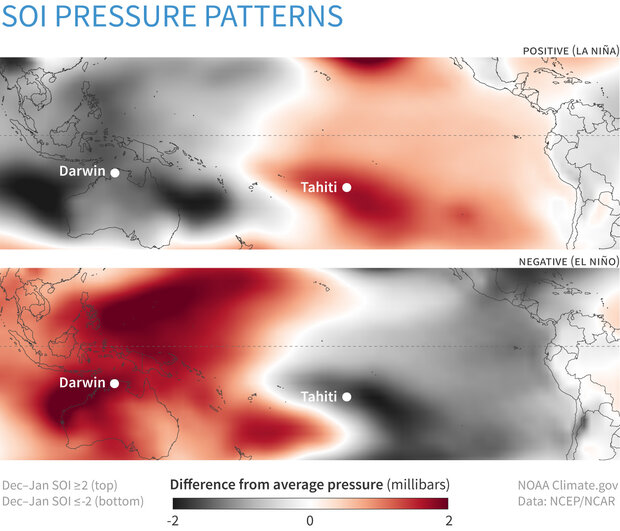
Difference from average sea level pressure during winters when the Southern Oscillation Index is strongly positive (top) or negative (bottom). During La Niña (positive SOI), the pressure is higher than average (red) over the central Pacific near Tahiti, and lower than average (gray) over Australia. During El Niño, the SOI is negative, and the anomalies are reversed. NOAA Climate.gov image, based on data from the NOAA Physical Science Lab.
Rossby waves: the original global delivery service
How do these teleconnections relate to weather patterns around the globe? Let’s move into high gear on atmospheric dynamics! Don’t worry, we won’t throw equations at you. Foundational to teleconnection patterns are large-scale atmospheric waves, specifically Rossby waves, named after the world-renowned meteorologist Carl-Gustaf Rossby. Rossby waves can persist from days to months and can vary from a few hundred miles long to spanning the entire planet! We’re calling the routes that Rossby waves travel “information superhighways,” as the waves carry information that can affect weather along their paths.
What exactly is this information that Rossby waves carry? When you see a wave traveling along the surface of water, there are peaks and troughs in the water height. The same happens in the atmosphere with a traveling Rossby wave – as the Rossby wave travels through the atmosphere, the peaks and troughs of the wave produce regions of high and low air pressure. These resultant pressure patterns, i.e. the “information” carried by Rossby waves, influence temperature, rainfall, wind, etc. In short, Rossby waves are fundamental to teleconnection patterns! (footnote 1)
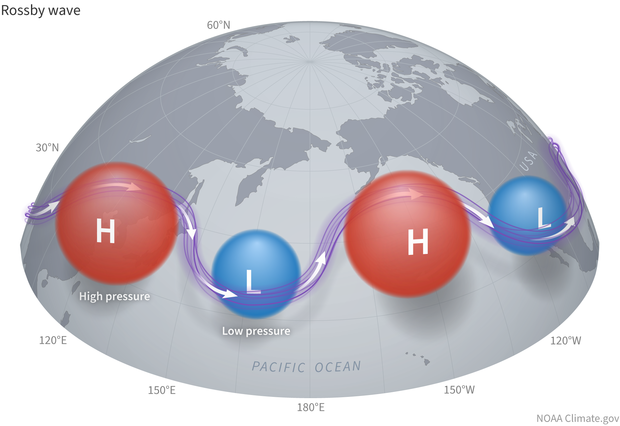
When a Rossby wave perturbs the Northern Hemisphere mid-latitude jet stream, warmer, high-pressure air is transported poleward into the wave crests, and cooler, lower-pressure air is transported equatorward into the troughs. The jet stream becomes a waveguide, steering the oscillation of the Rossby wave. NOAA Climate.gov image.
Where do they come from? Where do they go?
Rossby waves differ a bit from the large waves we are used to seeing in the ocean, which move up and down (vertically). Instead, Rossby waves in the atmosphere travel in the north-south direction (horizontally) due to the Earth rotating faster at the equator than at the poles. This leads to the Coriolis force, which causes moving air parcels to turn to the right as they move away from the equator toward the North Pole, where the effect (i.e., apparent deflection) of the Coriolis force is stronger. These rightward deflections turn the air back towards the equator, then the air is once again redirected back towards the poles as we move higher in latitude (footnote 2). This balancing act of air moving towards the poles and back towards the equator results in the development of an oscillating wave, which is how many planetary Rossby waves are formed (footnote 3).
Atmospheric Rossby waves (footnote 4) exist on time scales from just days to months and can be triggered by air flowing over Earth’s complex geography, like mountain ranges, as well as circulation patterns that arise due to unequal temperature heating (the equator gets more sunlight than the poles). Large regions of towering showers and thunderstorms near the equator, which are related to phenomena like ENSO and the MJO can also be responsible for revving the engine (i.e. triggering) of Rossby waves [4, 5] by disrupting the atmosphere via the heating that occurs when water vapor condenses into clouds. This heating causes rippling waves to form—much like dropping a stone in a lake.
Rossby waves are often rerouted and carried along by the jet streams, which are often considered as “waveguides” for Rossby waves. In other words, the jet streams set up the routes for the Rossby waves to flow through, similar to how a carved path in the sand is where water tends to flow. Whisked along by the jet streams, Rossby waves transport heat and momentum from the tropics toward the poles (south-to-north) and polar air towards the tropics (north-to-south). Thus, the location, strength, and even waviness of the jet stream dictates a substantial portion of the mid-latitude weather, including whether or not Arctic air will be dipping down into your neighborhood.
Rossby waves can be either stationary or transient. While stationary Rossby waves simply undulate over a region, meaning the peaks and troughs of the wave do not change location (like the standing wave in this previous ENSO blog post), transient Rossby waves traverse the globe, traveling west-to-east over thousands of miles. Scientists and forecasters study both types of Rossby waves due to their wide-ranging impacts and use them to predict where and how the weather may change anywhere from a few days to a few months in the future.
Signed, sealed, delivered
When transporting goods from one place to another, one could argue the transport isn’t complete until everything has been unloaded from the vehicle. In other words, it’s not enough to simply get from point A to point B. The same goes for the Rossby waves traveling along our global information superhighway. While all Rossby waves carry important information, some deposit larger signals along their shipping routes than others through a phenomenon called “Rossby wave breaking”. When Rossby waves break (imagine an ocean wave breaking on the beach or a towel folding) information is exchanged from the Rossby waves to the rest of the atmosphere through both the vertical and horizontal mixing of air parcels [6,7], completing the information transfer journey that began thousands of miles away.
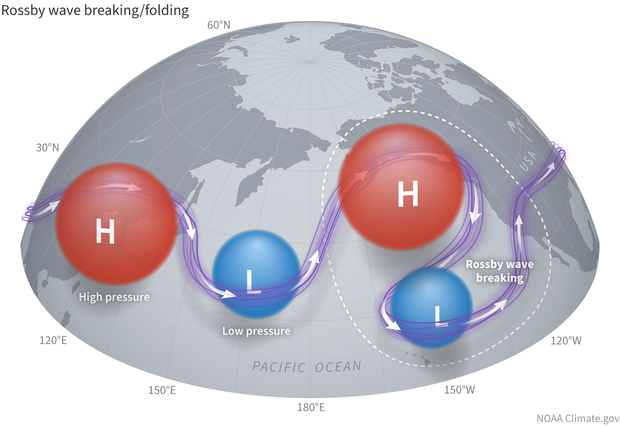
The oscillation of the Rossby wave can become so exaggerated that the wave breaks. Embedded air masses spin out of the jet stream: clockwise from ridges (in the Northern Hemisphere) and counterclockwise from the troughs. The breaking waves "hand off" the information they were carrying to the local atmosphere. NOAA Climate.gov image.
The information transfer facilitated by Rossby wave breaking has been associated with a multitude of phenomena around the globe. In the midlatitudes, breaking Rossby waves have been shown to modulate the phase of the North Atlantic Oscillation, the location of landfalling atmospheric rivers along the western coastlines of the United States and Europe [8,9,10,11] and the onset/dissipation of atmospheric blocking events [12,13,14]. When Rossby waves break more frequently closer to the equator they can also create an unfavorable environment for tropical convection [15,16,17], which serves to induce dry spell episodes in the Indian summer monsoon [18] and reduce the number of tropical cyclones that develop in the North Atlantic [19,20].
The frequency and location of Rossby wave breaking is primarily controlled by the jet stream [21,22], A.K.A. the backbone of the global information superhighway. The jet stream, in turn, is modulated by climate patterns of variability that exist on subseasonal (Madden-Julian Oscillation; [23,24], interannual (El-Nino Southern Oscillation; [25,26]) and multi-decadal (Pacific decadal oscillation, Atlantic multi-decadal oscillation; [27,28,29]) timescales. Each of these climate patterns can alter the infrastructure of our information superhighway by causing roadblocks, forcing detours, and/or building new routes. This means that, depending on the phases of the different climate patterns, Rossby waves that enter our information superhighway at the same on-ramp could end up with completely different MapQuest directions (remember those!?), travel times, and final destinations!
Last Stop!
In the atmospheric science community, Rossby waves are considered to be some of the most fundamental and important components of our weather and climate systems. Guided along by the jet stream, these Rossby waves serve as the foundation for teleconnection patterns, which provide a pathway for information (like temperature and pressure) to be transferred to and affect weather patterns in places thousands of miles away. Rossby waves are the vehicles that travel along our global information superhighway that keep our climate system fully connected and in constant communication. Thank you for traveling with us, we hope you enjoyed the ride!
Lead editors: Tom DiLiberto and Nat Johnson.
Footnotes
1) For those more math-inclined folks, Rossby waves can be derived from the non-divergent barotropic vorticity equation which describes conservation of absolute vorticity. By further applying assumptions and getting into some nitty-gritty algebra, we can also derive properties of Rossby waves, such as the dispersion relation (how waves relate to each other), phase speed (speed at which waves propagate), and group velocity (velocity of the wave packet). [30, 31]
2) Rossby waves specifically form from the conservation of potential vorticity. As fluids move from the equator towards the poles and are influenced by the Coriolis force, the conservation of potential vorticity acts as a restorative force to maintain the north-south direction of the oscillating wave. (Vallis, Geoffrey K. Atmospheric and oceanic fluid dynamics. Cambridge University Press, 2017.)
3) To better understand how Rossby waves are formed, let’s follow a parcel of air through the following thought experiment. The deflection of air can be thought of as a source of "spin" or rotation of a parcel of air and a parcel of air has to conserve its "total spin" (the Earth's spin + the atmosphere's relative spin). Think of a parcel of air that is pushed northward (in the Northern Hemisphere). The parcel moves into an area where the Coriolis force (i.e., the earth's contribution to the spin) is larger. Because the parcel conserves its spin, its relative spin has to decrease or move in the opposite direction of the Earth's spin. That corresponds to a clockwise rotation, which pushes the air that was originally displaced northward back to the south. When that air overshoots its original position, it then has to start spinning clockwise to conserve total spin, pushing the air back northward. And thus, the basic Rossby wave is formed.
4) Rossby waves don’t just exist in the atmosphere though, they also can form in the ocean! Oceanic Rossby waves are massive undulations of water traveling horizontally across ocean basins, usually taking months or years to cross. Interestingly, oceanic Rossby waves displace surface water on the order of inches, but water deep below the surface (~200ft down) undulates on the order of feet!
References
[1] Barnston, A. G., and R. E. Livezey, 1987: Classification, seasonality and persistence of low-frequency atmospheric circulation patterns. Mon. Wea. Rev., 115, 1083-1126.
[2] Van Loon, Harry, and Jeffery C. Rogers. "The seesaw in winter temperatures between Greenland and northern Europe. Part I: General description." Monthly Weather Review 106.3 (1978): 296-310.
[3] Stephenson, David B., et al. "The history of scientific research on the North Atlantic Oscillation." Geophysical monograph-American Geophysical Union 134 (2003): 37-50.
[4] Hoskins, Brian J., and David J. Karoly. "The steady linear response of a spherical atmosphere to thermal and orographic forcing." Journal of the atmospheric sciences 38.6 (1981): 1179-1196.
[5] Arcodia, Marybeth C., Ben P. Kirtman, and Leo SP Siqueira. "How MJO teleconnections and ENSO interference impacts US precipitation." Journal of Climate 33.11 (2020): 4621-4640.
[6] Scott, R., and J. Cammas, 2002: Wave breaking and mixing at the subtropical tropopause. J. Atmos. Sci., 59 (15), 2347-2361.
[7] Holton, J. R., P. H. Haynes, M. E. McIntyre, A. R. Douglass, R. B. Rood, and L. Pfister, 1995: Stratosphere-troposphere exchange. Rev. Geophys., 33 (4), 403-439.
[8] Payne, A. E., and G. Magnusdottir, 2014: Dynamics of landfalling atmospheric riversover the North Pacific in 30 years of MERRA reanalysis. J. Climate, 27 (18), 7133-7150.
[9] Zavadoff, B. L., and B. P. Kirtman, 2020: Dynamic and Thermodynamic Modulatorsof European Atmospheric Rivers. J. Climate, 33 (10), 4167-4185.
[10] Mundhenk, B. D., E. A. Barnes, E. D. Maloney, and K. M. Nardi, 2016: Modulationof atmospheric rivers near Alaska and the USWest Coast by northeast Pacific height anomalies. J. Geophys. Res. Atmos., 121 (21), 12751-12765.
[11] Hu, H., F. Dominguez, Z. Wang, D. A. Lavers, G. Zhang, and F. M. Ralph, 2017: Linking Atmospheric River Hydrological Impacts on the US West Coast to Rossby Wave Breaking. J. Climate, 30 (9), 3381-3399.
[12] Nakamura, H., 1994: Rotational evolution of potential vorticity associated with a strong blocking flow configuration over Europe. Geophys. Res. Lett., 21 (18), 2003-2006.
[13] Masato, G., B. Hoskins, and T. J. Woollings, 2012: Wave-breaking characteristics of midlatitude blocking. Quart. J. Roy. Meteor. Soc., 138 (666), 1285-1296.
[14] Tyrlis, E., and B. Hoskins, 2008: The morphology of Northern Hemisphere blocking. J. Atmos. Sci., 65 (5), 1653-1665.
[15] Knippertz, P., 2007: Tropical-extratropical interactions related to upper-level troughs at low latitudes. Dyn. Atmos. Oceans, 43 (1-2), 36-62.
[16] Kiladis, G. N., and K. M. Weickmann, 1992: Extratropical forcing of tropical Pacific convection during northern winter. Mon. Wea. Rev., 120 (9), 1924-1939.
[17] Allen, G., G. Vaughan, D. Brunner, P. T May, W. Heyes, P. Minnis, and J. K Ayers, 2009: Modulation of tropical convection by breaking Rossby waves. Quart. J. Roy. Meteor. Soc., 135 (638), 125-137.
[18] Samanta, D., M. Dash, B. Goswami, and P. Pandey, 2016: Extratropical anticyclonic Rossby wave breaking and Indian summer monsoon failure. Clim. Dyn., 46 (5-6),1547-1562.
[19] Zhang, G., Z. Wang, T. J. Dunkerton, M. S. Peng, and G. Magnusdottir, 2016: Extratropical impacts on Atlantic tropical cyclone activity. J. Atmos. Sci., 73 (3),1401-1418.Zhang, G., Z. Wang, M. S. Peng, and G. Magnusdottir, 2017: Characteristics and Impacts of Extratropical Rossby Wave Breaking during the Atlantic Hurricane Season. J. Climate, 30 (7), 2363-2379.
[20] Zhang, G., Z. Wang, T. J. Dunkerton, M. S. Peng, and G. Magnusdottir, 2016: Extratropical impacts on Atlantic tropical cyclone activity. J. Atmos. Sci., 73 (3),1401-1418.Zhang, G., Z. Wang, M. S. Peng, and G. Magnusdottir, 2017: Characteristics and Impacts of Extratropical Rossby Wave Breaking during the Atlantic Hurricane Season. J. Climate, 30 (7), 2363-2379.
[21] Thorncroft, C., B. Hoskins, and M. McIntyre, 1993: Two paradigms of baroclinic wavelife-cycle behaviour. Quart. J. Roy. Meteor. Soc., 119 (509), 17-55.
[22] Peters, D., and D. W. Waugh, 1996: Influence of barotropic shear on the poleward advection of upper-tropospheric air. J. Atmos. Sci., 53 (21), 3013-3031.
[23] MacRitchie, K., and P. Roundy, 2016: The two-way relationship between the Madden-Julian oscillation and anticyclonic wave breaking. Quart. J. Roy. Meteor.Soc., 142 (698), 2159-2167.
[24] Moore, R. W., O. Martius, and T. Spengler, 2010: The modulation of the subtropicaland extratropical atmosphere in the Pacific basin in response to the Madden-Julian oscillation. Mon. Wea. Rev., 138 (7), 2761-2779.
[25] Martius, O., C. Schwierz, and H. Davies, 2007: Breaking waves at the tropopausein the wintertime Northern Hemisphere: Climatological analyses of the orientation and the theoretical LC1/2 classification. J. Atmos. Sci., 64 (7), 2576-2592.
[26] Ryoo, J.-M., Y. Kaspi, D. W. Waugh, G. N. Kiladis, D. E. Waliser, E. J. Fetzer, andJ. Kim, 2013: Impact of Rossby wave breaking on US west coast winter precipitation during ENSO events. J. Climate, 26 (17), 6360-6382.
[27] Kwon, Y.-O., H. Seo, C. C. Ummenhofer, and T. M. Joyce, 2020: Impact of Multidecadal Variability in Atlantic SST on Winter Atmospheric Blocking. J. Climate,33 (3), 867-892.
[28] Zavadoff, B. L., and B. P. Kirtman, 2019: North Atlantic summertime anticyclonic Rossby wave breaking: Climatology, impacts, and connections to the Pacific Decadal Oscillation. J. Climate, 32 (2), 485-500.
[29] Zavadoff, B. L., and B. P. Kirtman, 2020: The Pacific Decadal Oscillation as a modulator of summertime North Atlantic Rossby wave breaking. Clim. Dyn., 56, 207-225.
[30] Vallis, G. K., 2006. Atmospheric and Oceanic Fluid Dynamics. Cambridge University Press, 745 pp.)
[31] Isaac Held Blog. https://www.gfdl.noaa.gov/blog_held/57-teleconnections-and-stationary-rossby-waves/
Comments
Historical Measurement
Is there any significant historical measurement of these waves both in magnitude and positions? Would it be possible to piece together old barometric pressure readings from around the world just as assumptions about ocean temperatures of the past are derived from old ship reports? It might be interesting to find out if their patterns have shifted, amplified, decreased, etc.
Hi Bailey, thank you for…
Hi Bailey, thank you for your question. As we mention in the post, historical measurements of teleconnections have been made all over the globe over the last thousand plus years. Unfortunately, much of this information is anecdotal and likely not enough to make any robust conclusions about changes in these teleconnections' magnitudes and positions. To make up for this lack of observed data, scientists run climate model simulations for thousands of years, analyzing terabytes of data to determine how Rossby waves, the jet stream, and subsequent teleconnection patterns have changed over time both naturally and due to climate change.
Questions about Rossby waves
Interesting post with fascinating information that would reward being re-read. So, thanks for writing it.
Here are my questions:
1) Can there be multiple Rossby waves in the Earth's atmosphere at the same time? If so, what would cause them?
2) What happens if two Rossby waves run into each other? Or, does this happen?
3) Do other planets or moons with atmospheres that we've observed in the solar system have Rossby waves?
Thank you for reading this, and I look forward to hearing from you.
response
Hi Matt,
We’re so glad you enjoyed the article and thank you for your questions! To answer:
Rossby Waves and Atmospheric Cells
Dr. Arcodia,
Thanks for answering my questions. What you wrote was very interesting, and further piqued my curiosity about Rossby waves, so I looked elsewhere on this site (my weather app is the NWS and NOAA websites) and learned more about them. They're fascinating.
That said, I had another couple of questions about them: Given the role they play with heat transfer between the equator and the poles, how do they interact with Hadley, Ferrell, and Polar cells? And, what role do they play with sudden stratospheric warming events, like what happened in early January 2021?
Thanks for reading this, and I look forward to hearing from you.
Matt
response
Hi Matt-
Thanks for your follow-up questions!
Rossby waves interact with the Hadley, Ferrell, and Polar cells as you mentioned. The circulation of these cells results in our subtropical and subpolar jets at the cells’ boundaries, which is where Rossby waves are often found. Further, Rossby waves triggered by tropical convection (storminess) that travel from the tropics to the extratropics are guided by the Hadley Cell circulation.
Rossby waves do play a role in sudden stratospheric warming events. When Rossby waves traveling in the troposphere get pushed higher into the atmosphere, they can extend into the stratosphere. Sometimes these Rossby waves can break (as discussed in the post) in the stratosphere and weaken the stratospheric polar vortex. The winds can even be reversed in which case, cold air falls and warms rapidly, resulting in a sudden stratospheric warming event.
Rossby waves
THANKS for this article. Very insightful. And looking forward to reading more on your own blog site. Going to pass it along to fellow meteorologists.
Wondering: Seems as though Rossby Waves are the jet stream? The jet streams form waves, some big, some small, etc.
Wondering also about the role of upper air mass divergence in the partial formation of high pressure ridges. The divergence from the ITCZ seems significant during some phases of ENSO.
keep up your good work of explanatory science🎉
Happy New Year,
Joe
response
Hi Joe,
Thanks for the comment! To clarify, Rossby waves and the jet stream are not the same entity, though the two phenomena are typically (though not always) collocated with each other. Rossby waves can and do exist independently of the jet stream. Furthermore, Rossby waves can both interact with and modulate the jet stream and vice versa.
Regarding upper air mass divergence and the formation of high pressure ridges, this is a common source of atmospheric Rossby waves. As these ridges build, so do stationary wave activity within them, which is eventually dispersed downstream as a Rossby wave. During ENSO, positive SST anomalies serve to promote convection and thus the development of anomalous convective heating in the upper atmosphere. This anomalous convective heating forces the formation of an upper level high pressure ridge as well as the build-up of stationary wave activity fluxes, which are then dispersed downstream as a Rossby wave. To summarize, during the different phases of ENSO positive SST anomalies can be located in either the eastern Pacific (El Niño) or western Pacific (La Niña), consequently dictating where high pressure ridges and subsequent Rossby waves are favored to form.
Himawari 8 IR Pacific
I've been looking at Himawari 8 IR, GOES W 9 and GOES E 9 and it looks as if most of the weather in the CONUS is being driven mostly by the Pacific. Seems mostly stuck in the same pattern with the Dec 23 cold as the only exception.
I am in SWPA and am thinking the balance of this winter will leave Pittsburgh at well below average snowfall and a rocky spring. Your thoughts greatly appreciated.
Unfortunately snowfall in…
Unfortunately snowfall in the east is often reduced during La Nina winters and this one doesn't seem to be an exception so far.
https://www.climate.gov/news-features/blogs/enso/what-about-snow-during-la-niña-winters
Rossby Waves
I am just a casual reader of meteorological info. Over the past couple of years I have been reading about all the various "weather oscillations" around the globe with keen interest in ENSO as it affects our US weather. In the past when I try to describe weather oscillations to my friends I tell them "there are these pillsbury dough boys around the globe of various sizes and shapes that bump into each other and thus affect each other and our weather. I know have a name for these effects - Rossby Waves. Am I correct in my thinking?
If I had my career to do over I would love to pursue a study in meteorology. Thanks for a great explanation of Rossby Waves. I will watch for more of these types of blog posts.
I like that analogy! Yup,…
I like that analogy! Yup, there's lots of things in our atmosphere that bump into other things causing chain reactions.
Comments have been disabled on this article