March 2023 ENSO update: no more La Niña!
La Niña—the cool phase of the El Niño-Southern Oscillation (ENSO) climate pattern—has left the building! After a year and half of non-stop La Niña, the tropical Pacific ocean-atmosphere system has transitioned to neutral, allowing NOAA to issue its “Final La Niña Advisory”. What can we expect for ENSO through the summer and into next fall and winter? I’ll get to that!
Get outta town
First, though, let’s bid La Niña adieu. The most recent weekly measurement of the sea surface temperature in the Niño-3.4 region (our primary monitoring region for La Niña and El Niño) was a mere -0.2°C (-0.4˚ F) compared to the long-term average. (To calculate a change in temperature in degrees Celsius to Fahrenheit, multiply by 1.8.) Also, the latest monthly value from the OISSTv2.1 dataset was -0.4°C (-0.7˚ F) for this same region. The threshold for La Niña is cooler than -0.5 °C, so we can say the ocean surface has moved away from La Niña.
Sea surface temperatures in the tropical Pacific Ocean from early January through early March 2023 compared to the long-term average. East of the International Dateline (180˚), waters remained cooler than average, a sign of La Niña. Graphic by Climate.gov, based on data from NOAA’s Environmental Visualization Lab. Description of historical baseline period.
The atmosphere is a little more complicated, as it tends to be! We still see some indications of a La Niña-like strengthened Walker circulation, with more rain and clouds than average over Indonesia, less over the central Pacific, and enhanced trade winds. However, without the cooler sea surface characteristic of La Niña, it’s likely this pattern will diminish in the coming weeks.
One measure of the atmospheric component of ENSO is the Equatorial Southern Oscillation Index (EQSOI), which measures the relationship between surface air pressure in the western and eastern Pacific. When this index is positive, it indicates that the Walker circulation is amped up. In February, after nearly a year at or above 1.0, the EQSOI was just 0.1 This tells us that at least one element of the atmospheric La Niña response has weakened.
We’re often going on and on here at the ENSO Blog about how ENSO is a seasonal phenomenon, meaning the ocean and atmosphere criteria must be met for several consecutive months in order to qualify as La Niña or El Niño. The same is not true for neutral conditions, however. Once the tropical Pacific ocean-atmosphere system is showing signs of decoupling, such as a monthly Niño-3.4 index value warmer than -0.5 °C, we can say that neutral conditions have likely arrived.
Spring breakers
The forecaster consensus is indeed very confident that neutral conditions will remain through the spring. We know what you’re really interested in, though—will El Niño develop? If we can anticipate an El Niño, we can anticipate an increased likelihood of its impacts on weather and climate. In contrast, a continuation of neutral conditions means the tropical Pacific Ocean will not be an actor on the world’s climate stage. The lack of El Niño or La Niña means that there is no seasonal-scale influence from the Pacific to push around the global atmospheric circulation and influence seasonal climate patterns.
Many of our computer climate models are predicting a transition into El Niño sometime later this year. However, right now is a very tricky time of year for the models, due to the “spring predictability barrier.” ENSO events peak in the winter and tend to decay and transition in the spring, so models often don’t have a lot of strong signals to go on. (Why do ENSO events peak in the winter?? This is a really complicated topic that we don’t have a simple, satisfactory answer to… (yet!)
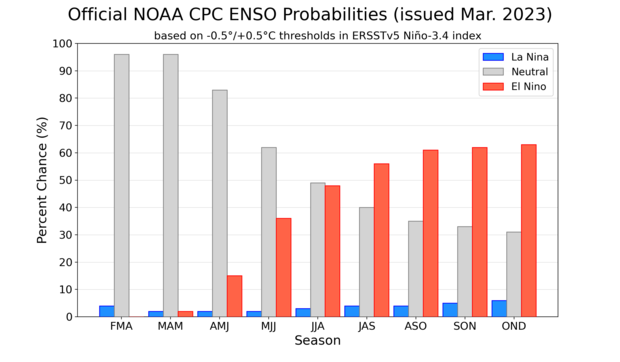
NOAA Climate Prediction Center forecast for each of the three possible ENSO categories for the next 8 overlapping 3-month seasons. Blue bars show the chances of La Niña, gray bars the chances for neutral, and red bars the chances for El Niño. Graph by Michelle L'Heureux.
Our forecaster consensus does reflect the increased chance of El Niño, with chances around 60% by the fall. However, the spring predictability barrier, together with the still somewhat-La Niña-ish atmosphere and the lack of strong physical signs such as a large amount of warmer-than-average subsurface water in the tropical Pacific, mean we’re not yet hoisting an El Niño Watch.
One fun little nugget of information is that, in our historical record dating back to 1950, we have not gone more than four years in a row without an El Niño. If we don’t have an El Niño in 2023–24, that will be five years! However, 73 years is a short record for a phenomenon that has decade-to-decade variability, so this is more of an interesting factoid than anything.
Meanwhile, in Peru
In the sea surface temperature animation above, you might notice a red patch growing off the coast of Peru in recent weeks. ENFEN (Peru’s commission on ENSO) recently issued a notice about the potential for a Coastal El Niño, an event which can have very significant consequences for rainfall in Peru. Coastal El Niño events can also spread west, preceding El Niño conditions in the Niño-3.4 region, so it’s something to keep an eye on. For more on the relationship between Coastal and larger-scale El Niño, check out this conversation between Michelle and friend-of-the-Blog Ken Takahashi back in 2017 (during the last coastal El Niño event), and Ken’s post about extreme El Niños.
I reached out to Ken about current events, and he pointed out that the Madden-Julian Oscillation, an area of increased storms that travels eastward around the equator over the course of one to two months, is in a phase that directly impacts Peru. Taken with the warm ocean surface, this is “a dangerous combination that may result in even heavier rainfall than what has already started to fall onto the northern coast of Peru,” he said.
Around-the-world cruise
As I mentioned above, the reason we care so much about El Niño and La Niña is that they can often be predicted months in advance, meaning we can get an early idea of some of our potential seasonal climate conditions. For example, the southeast coast of Africa tends to be cooler and wetter than average in December–February during La Niña.
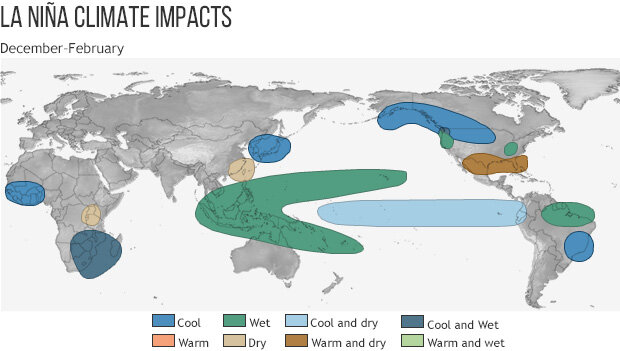
December-February climate patterns that are common during La Niña. NOAA Climate.gov map, adapted from original by the Climate Prediction Center.
Now that this La Niña has concluded, let’s take a look at how the December–February rain/snow and temperature patterns shook out around the world. In a couple of weeks, Tom will get into the winter weather in the United States, so stay tuned for a closer look there.
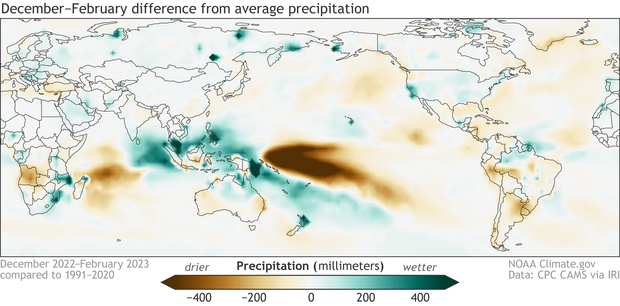
Global rain and snow patterns during December–February 2022–23, shown as the departure from the long-term (1991–2020) average. Brown colors indicate drier-than-average and green indicate wetter-tnan-average conditions. Climate.gov figure from CPC CAMS data, obtained from the IRI Data Library.
The first thing that jumps out here is the increased rain through the Maritime continent and northern Australia, and the dry region in the central Pacific, both expected La Niña impacts. Many of the more remote impacts that are common with La Niña, including increased rainfall in southeastern Africa and northeastern South America, and drier conditions around Uruguay, are also apparent here.
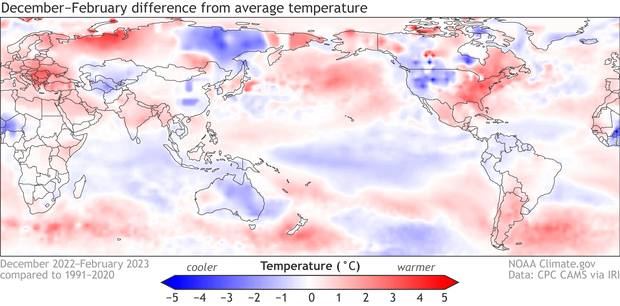
Global temperature patterns during December–February 2022–23. Temperature is shown as the departure from the long-term (1991–2020) average. Red indicates warmer-than-average and blue indicates cooler-than-average conditions. Climate.gov figure from CPC CAMS data, obtained from the IRI Data Library.
La Niña is linked to some cooler-than-average global impacts, including in western Africa, eastern Brazil, and eastern Asia. We don’t expect every ENSO impact to show up every winter—with random weather variations and the influence of climate change, ENSO is hardly the only player on the field—but overall, it’s not surprising that the December–February global patterns resemble the La Niña impacts.
If you dropped in today to get the final chapter of the daily temperature investigation (see parts 1, 2, 3), I’m sorry—there was just too much to cover this month. With at least a few months of neutral conditions expected, I will wrap that up in coming posts. See you in April!
Comments
Winters of 2010-2013 are all…
Winters of 2010-2013 are all Niño-free. There's even a possibility that the ONI of JFM 2015 fall short of 0.5℃ in the coming climatology—cutting off winter 2014-15 from the sequence of the strong Niño, thus it only has 4-month-run of ONI≥0.5℃, make 2014 a non-Niño year!
Fair point! If 2014-15…
Fair point! If 2014-15 winter gets reclassified in our table (when the climatology gets updated), then it'll be a streak of 5. We should asterisk that one. ;-)
La niña
Lol,not on the west coast! April 9th still have freezing temperatures at night with snow.
Predictions for ENSO
Will NOAA wait until the PDO turns positive before issuing an El Nino Watch ?
Thank you in advance,
Stephen S.
Good question. The PDO is…
Good question. The PDO is not used in ENSO forecasting mostly b/c it largely lags ENSO. See our past blog here.
La Nina
La Nina dying and California is about to get hit with another AR event. Central valley rivers are set to flood. These are crazy times indeed. If El Nino does in fact happen and the weather turns out as expected during an El Nino event not sure what is going to happen next winter as far as flooding goes.
Yes, pretty impressive…
Yes, pretty impressive precipitation out there! Here's our seasonal outlooks extending into next winter (this updates next Thurs. Mar. 16th): https://www.cpc.ncep.noaa.gov/products/predictions/long_range/
Next winter
Thanks Michelle,
I am not the expert, but I have a hard time putting stock in climate forecasts with such long lead times. Am I wrong?
It's a probabilistic…
It's a probabilistic forecast (% chance of). If you play the long game you probably will end up ahead:
https://www.climate.gov/news-features/blogs/enso/betting-climate-predictions
If these forecasts are considered deterministically ("this will happen") then you might be disappointed...
Thanks Michelle!
Thanks Michelle!
La Niña and precipitation in California
Is winter/spring going to go down as the rainiest La Niña on record?
para argentina no se…
para argentina no se menciona absolutamente nada, ni siquiera que el evento niña hizo elevar los promedios de temperaturas en 1°C y 2 °C dando condiciones totalmente fuera de contexto que perjudicaron gravemente las cosechas y cultivos, en cambio se favoreció a Brasil y otras partes del mundo con lluvias por encima de los promedios.
Desde el nacimiento de la niña a hoy las lluvias en Argentina simplemente desaparecieron, todo está totalmente seco, lagunas, lagos y muchos afluentes de arroyos desaparecieron, es muy feo ver como la gente sufre cuando pierde todo por lo que lucho y trabajo toda su vida por causa de la sequia supuestamente atribuida a la niña, creo que la noaa no es consiente de ello.
salutes
We wanted to quickly…
We wanted to quickly highlight the core ENSO regions... perhaps too broad brush, but the region around Uruguay shows precip deficits and they extend into adjacent countries too (including northern Argentina). Also keep in mind the maps above are only for a specific 3-month average period (Dec-Feb 2022-23). Drought builds up over longer periods of time, and involves variables like soil moisture, and that's not examined here. But I have read the longer-term drought has been very harmful for folks and interests in Argentina... thanks for sharing your observations in the comments and take care.
Totaly agree
With no news from Argentina, the Pampas region suffered the driest and hottest summer in history. We also have to take into account that last year was the driest in a long time. And it still hasn't rained in many areas....
Thank You
Thank you Michelle great article !
Stephen S.
Million-dollar question
Great article and chat! Congratulations to all the team.
The million-dollar question is now when will occur the transition from ENSO neutral to El Nino. Models seem too optimistic for a more or less quick transition but it might not be so linear. It seems a bit contraditory that we say that El Nino can be predicted several months ahead but in fact that's not the case now. We need to wait for May to have more confidence in the forecasts. What do you think Michelle? Cheers
Models
I have been impressed with just how accurate the SST model plumes have been even several months in advance. They seemed very accurate this year as to the strength and timing of La Nina
I agree.... think the models…
I agree.... think the models were pretty spot on with this late winter/early spring transition to neutral.
Conversion calculations
This is incorrect. "(To calculate a change in temperature in degrees Celsius to Fahrenheit, multiply by 1.8.)" After multiplying, add 32 to finish the conversion.
Re: Conversion calculations
I'm gonna answer this one for the bloggers because I was the one who suggested we add that bit as a way to keep from having to convert every single temp anomaly in C that was in the post to its corresponding F anomaly. --Rebecca
We get versions of this comment quite often, and it is an easy mistake to make. Your assumption is based on the conversion between two absolute temperatures, but we are talking here about an anomaly, which is a change in temperature. You can prove to yourself that our shorthand is correct with some basic math.
How does a change in temperature in ˚F compare to a change in temperature in ˚C?
Let’s look at a change that we know must be physically equal, no matter the scale: the difference between the boiling point of water and the freezing point. We know that these must be equal because they measure the same physical process, the same amount of energy change.
In ˚F, that change is…
Tboiling minus Tfreezing = 212˚-32˚= 180˚
In ˚C, that change is…
Tboiling minus Tfreezing = 100˚-0˚= 100˚
So, a change of 100 ˚C equals a change of 180 ˚F.
If change of 100 ˚C= change 180˚F, then a change of 1 ˚ on the Celsius scale is 1.8 times smaller than a change of 1 ˚on the Fahrenheit scale. So to convert a change (or an anomaly, or a difference) in ˚C to a change in ˚F, multiple the ˚C by 1.8. To convert from a change in ˚F to a change in ˚C, divide by 1.8.
Looking forward to Neutral and El Nino
Kenya has suffered from prolonged droughts and poor rainfall because of La Nina since 2021. I am really glad we have crossed over to neutral and looking forward to El Nino as this means we will get more rain than normal. Thanks for the update, good news after a long time of suffering :).
Thanks for reporting your…
Thanks for reporting your conditions... hopefully rainfall will continue to improve!
indian ocean dipole
Kenya is affected by the Indian Ocean Dipole much more than ENSO
how does La nina / el nino affect winds in central USA
As a renewables energy professional , i have been looking how la nina / el nino affect winds across the USA. higher / lower than average . prevailing wind changes or other event . I have not been able to find any data .
You might like this link…
You might like this link from our colleagues at NOAA PSL:
https://psl.noaa.gov/enso/compare/
I don't know of any finer resolution products which may be more useful for your purposes.
El Nino, pacific hurricane season
Hi Michelle,
Great article.
What can we expect from the El Nino season with regards to the Pacific hurricane activity? Frequency and intensity.
Many thanks
Look for NOAA's seasonal…
Look for NOAA's seasonal hurricane season update sometime in May! At this time, it's still a little too early to say much.
Good post
This was an informative and interesting post that explained more about how La Nina has ended and what could happen going forward.
Emily Becker (Dr.?) also did a good job of explaining that, even though the models suggest there's a decent chance of an El Nino forming in the next few months, it is hard to say what's going to happen ENSO-wise this fall or next winter, due to the spring predictability barrier. (Likewise for what it might mean for the climate here in Oklahoma next fall and winter.)
I look forward to reading future ENSO blog posts, and getting a better idea of how ENSO works and how other factors play a role in climate along with it.
Yep, Dr. Becker does a great…
Yep, Dr. Becker does a great job with her descriptions. Thanks for the kudos. You might also like our index page which sorts out past articles:
https://www.climate.gov/news-features/blogs/enso/index-page-enso-blog-posts
Reply
Dr. L'Heureux (is that correct?): Dr. Becker does write good descriptions with her posts. Then again, she's in good company with this blog's other writers.
Also, thanks for the link. I do look at previous ENSO Blog posts from time to time (particularly if I see one linked to a post), so it will be useful to have that. That said, would you guys mind adding that link at the top or bottom of future posts? It would make it easier to find and read older posts. (As well, I look at them through my phone's weather app, which is the NWS and NOAA websites, so having links like that would be even more useful.)
Too, I was also wondering if there are other NOAA or NWS blogs like ENSO Blog (such as for winter weather or severe weather, among other areas). The ones your team writes are really interesting and educational, so it would be good to know if there are others like it.
Thank you for reading this, and I look forward to hearing from you.
Never mind
I figured out how to get there: Click / tap on "menu" (upper right corner of this post, as well.as climate.gov), click / tap the + sign next to "News & Features," and click / tap the link for "blogs." It shows a list of the NOAA blogs (though, when I looked last time, I didn't see ENSO blog--though maybe I didn't look closely enough).
Regardless, thanks for the interesting and informative blog posts.
Will El Niño be weak moderate or strong
I am just wondering if El Niño will be weak or moderate or strong??? I am hoping weak El Niño. Last time it was weak El Niño back in 2018-2019. I had super cold January and February and that was weak El Niño even tho December 2018 was super warm.
We provide probabilities…
We provide probabilities that Niño-3.4 index will be in excess of certain thresholds here (this updates on the 2nd Thursday of every month):
https://www.cpc.ncep.noaa.gov/products/analysis_monitoring/enso_advisory/strengths/index.php
Moderate
I think moderate, similar to 2002-03.
SUDESTE BRASIL
aqui no sudeste do Brasil tivemos 3 verões amenos e úmidos... Mas este foi particularmente fresco
NAO, AMOC, record drought and heat in Europe and Asia
Even this time last year, an El Niño was predicted, but in May 2022 it became clear that this prediction was wrong. Could it be, that the same is happening now? Here in Europe, there was very severe drought conditions and extreme heat from April 2018 to January 2019, and that was an El Niño year. Regarding temperatures around the north Atlantic, it is often said that NAO and AMOC indices reflects the realities much more than ENSO. But I note (I'm no expert) that since 1987/88 there has only been two european winters which were colder than normal: 1995-96 and 2012-13. The NAO has had a very clear tendency to be more and more positive since 1965-70, see
https://www.cpc.ncep.noaa.gov/products/precip/CWlink/pna/JFM_season_nao…
My observation is, that every winter since 1987/88, with the exceptions of only 1995/96 and 2011/12 , has been colder than normal in the region SW Greenland to NE Canada (Baffins Land). Since the mass balance for the inland ice/glaciers in both Baffins Land and western Greenland has been more negative in this period too, could this maybe (among other things) be caused by more fresh meltwater on top of the seawater between Baffins Land and W Greenland, which weakens the Irminger current (an arm of the warm N Atlantic current)?
There has actually been some…
There has actually been some research done on the tendency of models to predict MORE of something if that something has already happened. From the abstract, "Models tend to predict warming when initialized after observed warming conditions and cooling when initialized after observed cooling conditions. "
That's one reason for caution and why even with current conditions (anomalous warm water at depth) conducive for El Nino development later this year, that probabilities were still 60-40%-ish on its development.
https://agupubs.onlinelibrary.wiley.com/doi/full/10.1029/2020GL087008
La Nina
This time last year, an El Nino WAS NOT predicted. The odds last year at this time was spread fairly evenly between La Nina and ENSO neutral with El Nino highly unlikely. While it is too early to say with confidence before the spring predictability barrier, the SSTs in the equator looks much different than this same time last year with rapid heating occuring
Weak El Nino and Snowfall in Kentucky
I noticed on the list of years of weak El Nino's that we had a lot of back to back Snowstorms here in Kentucky. Is this scenario due to an active Subtropical jet combining with the Polar jet ( over the Southern Rockies ) plus a very weak Southeast Ridge in place ? The years of strong to very strong El Nino's were very warm and wet like La Nina years here in the Ohio Valley. Does this increase in El Nino's Strength amplify the Southeast Ridge like the years of moderate to very strong La Nina years ?
Thank You in advance,
Stephen S.
Good question. El Nino and…
Good question. El Nino and La Nina can certainly impact the storm tracks across that region. Though snow can be fickle as it also requires there to be enough cold air in place. It's hard to say.
In general, La Nina's and the negative PNA pattern tend to go together, along with El Ninos and positive PNAs (https://www.climate.gov/news-features/understanding-climate/climate-var…)
But with the strongest the El Nino or La Nina, the most consistent the impact on our weather.
to neutral enso
After enjoying a pleasant and warm February here in Ohio was looking forward to much of the same this spring. Checking the latest forecast maps, it looks like el nino will keep it cool sand wet not only here but out west.
Thanks for the heads up.
California weather
Well, here on the Central Coast of California we are double our normal rainfall and we’re not done yet! Amazing amounts of precip throughout the state and record snowpack in the southern Sierra. Going into the fall we all thought (as was predicted) that it would be a below normal precipitation year. I read somewhere that the record years were not El Niño years, and this year seems to confirm that. I’m not putting much stock into next winter as to if it’s El Niño or not for storminess at this point, especially since it depends on what kind of El Niño it is. Despite the flooding, we are relieved and thankful for what we have had so far this year. Thanks for your blogs, they are interesting and informative- keep up the good work!
Lot of thanks!
Again, thank you so much for sharing. To us, as fire managers, this info is very useful and we trust it for our short, medium and long term plans. During a very long time we can not work with fuel treatment for reduction due to the prohibitions based on dry and hot conditions forecasted for the weather for the last months of 2022. But october was rainy, and even cold, november was incredible cold, march is rainy, and so. Due to that "not fuel reduction", now we have so much fuel to work with...hopefully the El Niño take a nap on the way here and let us do some treatment. If not, fires will be exacerbated with that fuel growing by the El Niño rains for spring-summer here (I write from Paraguay). Hope my interpretation of your blog is good. Gracias!
Thank You Tom !
Thanks Tom for your reply on the various strengths of ENSO and the effects on our Climate here in Kentucky.
Best Regards,
Stephen S.
Let's say good riddance to La Nina!
I'm glad that La Nina that lasted almost three years (from 2020-2023) has ended that caused alot of severe weather here in Upstate New York, like what happened back on October 7, 2020 with a derecho that was destructive, that caused power outages that lasted 2 days, or even for one week, and some tornadoes in some parts of Upstate New York, and in the lower Hudson Valley. With El Nino, it would help protect upstate New York and the Northeast U.S. from severe weather.
El Niño
El Niño boo hiss go away El Niño you’re not welcome in North Carolina in December of 2002 you jinxed us with a ice storm
Comments have been disabled on this article