Has climate change already affected ENSO?
This is a guest post by Mike McPhaden, who is a senior scientist at NOAA Pacific Marine Environmental Laboratory in Seattle, WA. Mike has previously blogged with us and was lead editor of the book “El Niño- Southern Oscillation in a Changing Climate” published by the American Geophysical Union. He has had a prolific career, including spearheading development of the Tropical Atmospheric Ocean (TAO) buoy array across the equatorial Pacific Ocean, which is key to observing and understanding ENSO.
For more than 30 years, climate researchers have been puzzling about how human-forced climate change affects the El Niño Southern Oscillation (ENSO), the warm phase of which we refer to as El Niño and the cold phase as La Niña. There are two aspects to this question:
- Has climate change affected ENSO already? and
- How will climate change affect ENSO in the future?
Arguably, we have made more progress on the second question than the first because greenhouse gas forcing in the future is expected to be stronger than it has been up to now; the stronger the forcing, the more obvious its impacts become. Whether climate change has already affected ENSO has been a harder nut to crack. A previous blog article by Tom DiLiberto summarized the conclusions from the latest IPCC report, which essentially found that there was no clear evidence yet for an impact of climate change on tropical Pacific sea surface temperature (SST) anomalies related to ENSO. However, in a recent study published in Nature Reviews Earth and Environment, Wenju Cai and colleagues revisit this question, reviewing past studies and performing new analyses to provide additional insights on this important question.
One of the primary sources of information we have for past ENSO behavior is the instrumental record of sea surface temperatures (SST) from the tropical Pacific. Many have noted that the most recent period of the observed SST record in key ENSO index regions, like Niño-3.4, exhibits higher-amplitude variability than the early part of the record. The most recent 50-60 years, for example, appears to be more energetic, with larger swings up and down, than the previous 50-60 years. Cai and colleagues make this point using several different data sources and methods—evidence that the pattern is real, not just a data quality problem due to the relative sparsity of data before 1950.
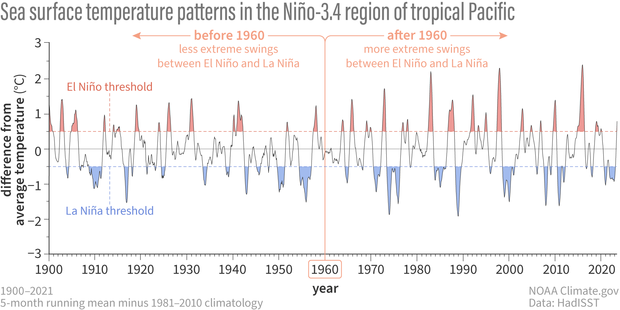
Sea surface temperature in the Niño-3.4 region of the tropical Pacific from 1900 to 2023. Monthly data have been smoothed with a 5-month running mean after removing a seasonal climatology for 1981-2010. Red peaks are El Niño events and blue troughs La Niña events. The approximate mid-point of the time series is indicated by the vertical black line in 1960. The white area between ±0.5°C signifies neutral conditions. Data is from HadISST, which uses satellites and other in situ observational data.
Assuming the bigger swings are real, the key question is why? We might expect climate change to have already made an impact on ENSO because the atmosphere now holds 50% more heat trapping greenhouse gas concentrations than it did at the start of the Industrial Revolution (footnote #1). The challenge is to tease the forced part of the signal out of the background noise of natural ENSO variations. The question can't be answered by just the data itself because the record is too short and the farther back in time we go, the less reliable the data becomes. Just because the most recent period has stronger variability (those larger ups and downs mentioned above) than earlier periods does not automatically mean that climate change is the cause, since it could be just the natural waxing and waning of ENSO cycle variations from one decade to the next.
Cai and colleagues use the full arsenal of multi-century-long computer simulations from the latest generation of climate models, combined with sophisticated analysis techniques, to address this question. The model simulations are not intended to exactly mimic the historical record of ENSO variations. However, many of these models can reasonably simulate key aspects of the observed dynamics and statistical behavior of ENSO (footnote #2). The authors use multiple different analysis approaches from which a consistent result emerges: there is a high likelihood that ENSO variations have increased in amplitude by up to 10% since 1960 due to the observed rise of greenhouse gas concentrations in the atmosphere.
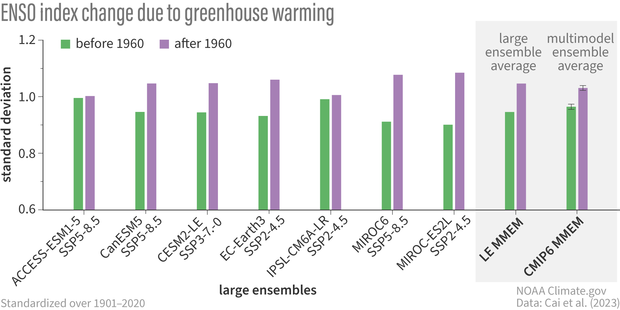
An ENSO index that characterizes variability in the 60 years before 1960 (green) and the 60 years after 1960 (purple) for several models, each with a very large ensemble (about 40 on average) of simulations (footnote #3). The y-axis shows the standard deviation of the index. The mean across the multimodel large ensemble averages is designated LE MMEM and the multimodel ensemble average across all Coupled Model Intercomparison Project 6 (CMIP6) models is designated as CMIP6 MMEM. See paper for details.
One manifestation of this amplified cycle is that strong El Niño and La Niña events are becoming stronger and more frequent, just as we’ve observed in the more recent historical record. The big events pack the most punch, so even though 10% doesn't sound like much, it juices up the strongest and most societally relevant year-to-year climate fluctuation on the planet. Combined with the other ways global warming has affected ENSO impacts (footnote #4), this amplified cycle translates into more extreme and frequent ENSO-linked droughts, floods, heat waves, wildfires and severe storms like we observed during the recent triple dip La Niña that ended last March and the major 2015-16 El Niño a few years ago.
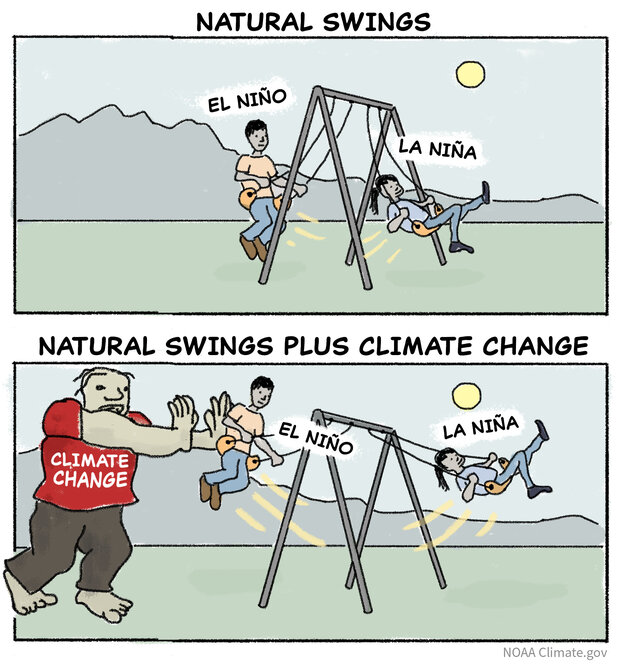
Illustration by Anna Eshelman, NOAA Climate.gov.
This work forms a bridge to past research that clearly indicates ENSO variations are likely to become even stronger (by 15-20% under high emission scenarios) later this century if atmospheric greenhouse gas concentrations continue to rise. The article also goes beyond just saying that there is a detectable signature of climate change in ENSO cycle variations today; it also explains how this happens in physical terms. ENSO arises from self-reinforcing feedbacks between the atmosphere and ocean and those feedbacks become stronger in a warmer world. Under increased greenhouse gas forcing, the upper layers of the tropical Pacific warm faster than the deeper ocean. The warmer surface layer enhances precipitation, and together they increase the density stratification of the upper ocean, making it more sensitive to wind forcing. Thus, the coupling of the ocean and atmosphere becomes stronger, making the swings between El Niño and La Niña more extreme.
There are caveats though. The saying “All models are wrong, but some are useful,” attributed to the British statistician George Box, applies here. The conclusions of this study rely on the current generation of climate models, which have known limitations in the tropical Pacific Ocean. However, they are the best tools available to us for addressing this problem, and Cai and colleagues wring out every bit of information there is from them to make their case.
Lead Editor: Michelle L’Heureux (NOAA)
Footnotes:
(1) Why might increasing greenhouse gases lead to increased variability? Climate change can exert its influence in two ways: through “thermodynamics” and “dynamics.” Thermodynamics is easy to understand as it is the direct response to increases in heat trapping greenhouse gases in the atmosphere. The dynamics, related to winds and currents in our atmospheric and oceanic system, can change too, leading to increased ENSO variability as we explain later in this blog post.
(2) Because of known imperfections in climate models, we don’t want to rely on just one model. So, Cai and colleagues used over 40 models (called an “ensemble”) and while these models may all be imperfect, they are imperfect in different ways. So, if we make an average across the ensemble (what we call an “ensemble mean”) we can extract useful information that will be more reliable than provided by any individual model alone.
(3) Single-model large ensemble experiments are useful for characterizing uncertainty due to internal variability as opposed to uncertainty due to model differences. Each ensemble member is generated from slightly different initial conditions, which through the "butterfly effect" of chaos, yields a different time history for each ensemble member. The spread of the different members is a measure of internal variability, which can be reduced by averaging across all members to form an ensemble mean. In the study by Cai and colleagues, further confidence is gained by averaging the ensemble mean of seven model large ensemble experiments (what they call the large ensemble multimodel mean, or LE MMEM).
(4) Climate change can amplify ENSO impacts, even if ENSO properties and dynamics are not affected. The reason is simple. A warmer atmosphere holds more moisture, so that when ENSO events lead to conditions that favor enhanced precipitation in a particular region, it can rain even harder. Likewise, greenhouse gas forced warming trends can lead to soil moisture deficits that help to intensify ENSO-related drought development. So, it's a double whammy if in fact greenhouse gas forcing does boost the variability in ENSO cycle sea surface temperatures, like Cai and colleagues argue, since not only will ENSO be stronger but its impacts will be further amplified.
Comments
Winter
Do you think will snow in the east?
We will have a post all…
We will have a post all about El Niño + snow in October!
Comments have been disabled on this article