August 2023 El Niño update: back to school
It’s that time again! And by “that time,” I mean the El Niño forecast update, of course. The chance that El Niño—the warm phase of the El Niño Southern Oscillation (aka “ENSO”) climate pattern—will continue through the winter is greater than 95%, so let’s sharpen our pencils and get into the details of what that means for upcoming seasons.
Mathematics
Greater than 95% is a very strong chance! Forecasters’ confidence that El Niño will continue is based on a few factors. First, the east-central tropical Pacific is quite warm. Specifically, our primary El Niño-monitoring metric, the Niño-3.4 Index—the average sea surface temperature in the Niño-3.4 region in the east-central tropical Pacific—was 1.0 °Celsius (about 2 °Fahrenheit) warmer than the long-term average in July, according to our most reliable dataset, ERSSTv5. (Long-term = 1991–2020.)
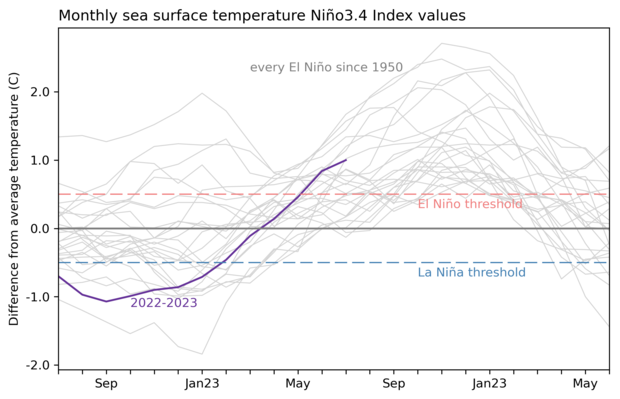
The three-month-average Niño-3.4 Index, the Oceanic Niño Index, was 0.8 °C above the long-term mean for the May–July average, the second three-month-period in a row above the El Niño threshold of 0.5 °C. We need to see five consecutive three-month averages above this threshold before these periods will be considered a historical “El Niño episode” and colored red in our ENSO record). Two is a good start, especially with the 0.8 °C recording from May–July. If this El Niño were to collapse after hitting this high, dropping back below the threshold of this magnitude before next winter, it would be the first time in our historical record, dating back to 1950.
Social studies
El Niño is a coupled phenomenon, meaning the changes we see in the ocean surface temperature must be matched by changes in the atmospheric patterns above the tropical Pacific. The average atmospheric circulation over the tropical Pacific, the Walker circulation, is like a conveyor belt: rising air over the very warm far western Pacific, west-to-east winds high up in the atmosphere, descending air and dry conditions over the east-central Pacific, and returning east-to-west winds near the surface—the trade winds.
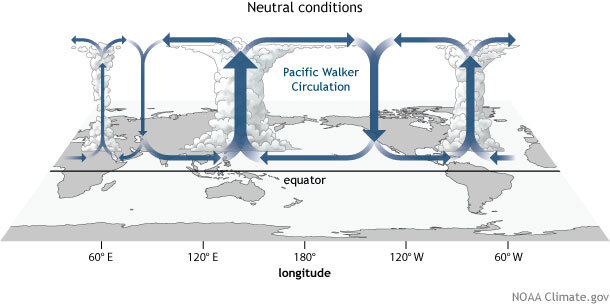
Generalized Walker Circulation (December-February) during ENSO-neutral conditions. Convection associated with rising branches of the Walker Circulation is found over the Maritime continent, northern South America, and eastern Africa. NOAA Climate.gov drawing by Fiona Martin.
During El Niño, the warmer east-central tropical Pacific Ocean surface leads to lower surface air pressure and more rising air, clouds, and rain over that region, weakening the overall circulation. The trade winds slow, and drier conditions and higher-than-average air pressure are observed over the western Pacific and Indonesia. The ocean-atmosphere coupling is both how El Niño perpetuates itself, as the atmospheric changes feed back into the oceanic changes, and how El Niño affects global weather and climate.
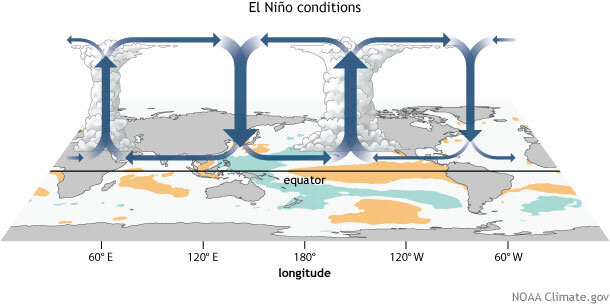
Generalized Walker Circulation (December-February) anomaly during El Niño events, overlaid on map of average sea surface temperature anomalies. Anomalous ocean warming in the central and eastern Pacific (orange) help to shift a rising branch of the Walker Circulation to east of 180°, while sinking branches shift to over the Maritime continent and northern South America. NOAA Climate.gov drawing by Fiona Martin.
In July, we observed more rain and clouds over the central Pacific, with somewhat drier conditions in Indonesia, and some reduced trade wind activity in the western Pacific. The Equatorial Southern Oscillation Index, which measures the relationship between surface air pressure across the Pacific, was -0.9 in July, indicating weaker pressure in the eastern Pacific and higher in the western. Taken together, these are all signs of the atmospheric component of El Niño, providing more confidence that the system is engaged and that these conditions will last through the winter.
Computer science
Our global climate models are predicting that the warmer-than-average Pacific ocean conditions will not only last through the winter, but continue to increase. There is a good chance—approximately 2 in 3—that the peak Oceanic Niño Index this winter will match or exceed 1.5 °C, our informal threshold for a “strong” El Niño event. This is more confident than last month, in large part because the peak of this El Niño is one month closer, and, as I mentioned above, the surface is already 1.0 °C warmer than average.
Animation of maps of sea surface temperatures in the Pacific Ocean compared to the long-term average over five-day periods from the end of May to early August 2023. The waters in the key monitoring region, which scientists call "the Niño-3.4 region," progressively become warmer than average (red) as El Niño builds. NOAA Climate.gov, based on Coral Reef Watch maps available from NOAA View.
The sea surface temperature changes associated with El Niño events usually peak in November–January or thereabouts. Why? We still don’t know exactly why ENSO’s seasonal cycle is timed the way it is, with most events peaking in the winter and decaying through the spring. There is still a lot to learn!
Geography
El Niño’s most extensive impacts on global climate also occur during the winter and early spring. (I’m using Northern Hemisphere seasonal terms here.) Typical impacts include more rain and storms across the southern tier of the United States, southeastern South America, around the horn of Africa, and eastern Asia. Drier conditions are often found in December–February during El Niño through the Maritime continent/Indonesia, southeastern Africa, and northeastern South America. El Niño affects summer (June–August) climate, too, including drier conditions through the Caribbean, Indonesia, India, northern South America, parts of Central America, and eastern Australia.
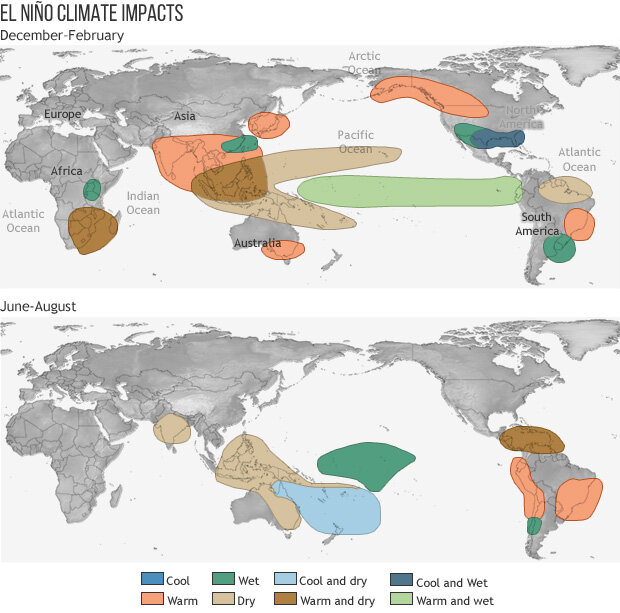
These maps show winter and summer global ENSO impacts.
El Niño is also known to interact with the Atlantic and Pacific hurricane seasons, with El Niño years tending to be less active in the Atlantic. In the hurricane season outlook released in May, NOAA scientists expected the potential suppressing effect of El Niño may be offset by the much warmer than average Atlantic Ocean surface, as warm water provides fuel for hurricanes. NOAA’s update to the outlook will be released later today, so be sure to keep an eye out for that!
Experimental psychology
Speaking of the warm Atlantic, you’ve probably heard about the recent unusually high global average temperatures. Some of the world’s oceans are extremely warm (North Atlantic, Southern Ocean, and so on), and there have been long-lasting heat waves across many land regions. El Niño is linked to higher global averages, although this El Niño is just getting going and can’t be blamed for all the heat events that have occurred already this year. (In fact, over North America, impacts tend to be very weak during the summer). There’s a good chance, though, that it will contribute to (at the very least) a top-3 average temperature for 2023. In a guest post in June, Karin Gleason discussed how NOAA predicts the global average temperature.
But what are the computer climate models predicting? Michael Tippett of Columbia University, noted friend-of-the-blog, took a look at some of the predictions from the North American Multi-Model Ensemble. These graphs are a lot, so bear with me!
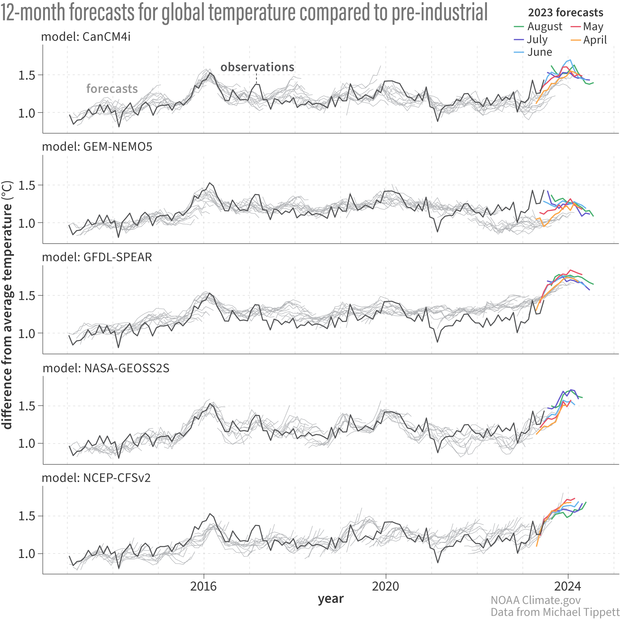
Global average temperature forecasts from the North American Multi-Model Ensemble, from an original by Michael Tippett of Columbia University. Each panel shows the forecast from one model, relative to the “pre-industrial” period—that is, the increase in global average temperature since 1850. The black line shows the observed global temperature, from the Hadley Center’s HADCRUT5 temperature record. The gray lines are forecasts starting in April, May, June, July, and August from previous years, starting in 2013. The most recent forecasts, from April, May, June, July, and August of 2023, are on the right-hand end, in colors. For most models, the forecasts extend out 12 months—for example, the forecast made in June 2014 goes out to May 2015. These forecasts have the same structure as our Niño-3.4 forecasts, but instead of predicting the average sea surface temperature in the Niño-3.4 region, they’re predicting the average temperature over the entire globe. For help visualizing the separate forecasts, take a look at this animation showing Niño-3.4 forecasts from 2015–16. Figure by climate.gov based on data from Michael Tippett, obtained from the IRI Data Library.
Each panel shows the global average temperature forecast from one model, relative to the “pre-industrial” period—that is, the increase in global average temperature since 1850. To see how the predictions vary from month-to-month, Mike has included forecasts made in April, May, June, July, and August of each year, starting in 2013. The most recent forecasts, from April, May, June, July, and August of 2023, are on the right-hand end, in colors.
The gray lines are forecasts from previous years. For most models, the forecasts extend out 12 months—for example, the forecast made in June 2014 goes out to May 2015. The black line shows the observed global temperature, from the Hadley Center’s HADCRUT5 temperature record. These forecasts have the same structure as our Niño-3.4 forecasts, but instead of predicting the average sea surface temperature in the Niño-3.4 region, they’re predicting the average temperature over the entire globe. (For help visualizing what I mean, take a look at this animation showing Niño-3.4 forecasts from 2015–16.)
The different models and the different monthly forecasts show that there is some variation in the predictions overall. Most models suggest that the global average temperature will substantially exceed that of early 2016, our last strong El Niño event, but not all of them. Month-to-month, the predicted average can shift around. You can also see that the 2016 record was pretty well predicted by the models. There are a lot of things to note in these graphs, but I’m running out of space here, so I leave you to your studies. What do you observe? Let us know in the comments!
Comments
About the atmospheric conditions...
Even though the Southern Oscillation Index supports the atmospheric conditions necessary for the development of El Nino, the overall low-level wind conditions (appears to me) are unusually calm, lacking any noticeable westerly wind anomalies. It would be wonderful if you could share your opinions or comments on this matter.
I agree we're not seeing…
I agree we're not seeing widespread strong westerly winds of the type that preceded 97-98, 15-16, but I think we are seeing an uptick in westerly wind anomalies, especially when compared to the previous three years. Some real-time plots I consult are from the NCEP/NCAR reanalysis:
https://www.cpc.ncep.noaa.gov/products/analysis_monitoring/enso_update/u850a_c.gif
CFSR (I like Carl Schreck's page here).. have to select winds and 850mb: https://ncics.org/portfolio/monitor/mjo/
Thank you
Thank you Michelle for sharing the comment and website. Thet are very helpful!! 😀
Role of wind
That's because wind is an effect, not a cause of El Nino. The wind only develops after a pressure gradient builds up across the equatorial Pacific (what is measured by the SOI is a pressure differential). Wind then follows the pressure gradient blowing from high pressure to low pressure. The challenge is that the winds may not show much lag and so many think that winds are a cause. The actual cause is much more likely tidal forces acting on the subsurface thermocline. This is the hypothesis of a few ex-NASA-JPL scientists, a group at Ohio State, and myself with a published model from a few years ago. Cheers.
The overall validity of our approach to ENSO.
Good point about the westerly wind anomalies.
Also, the SOI is not yet particularly strongly confirming this El Nino.
I am not at all convinced that our traditional way of assessing the strength of the phases of ENSO by measuring the temperature anomaly of the Nino 3.4 measurement area continues to be valid.
One can not help but notice that NOAA is reporting the values in the other Nino areas more often than I recall happening in the past.
The warming of the oceans raises a lot of questions in my mind about the validity of our approaches.
I would be paying a lot more attention to the Aleutian Low, the Hawaiian High and the North Pacific Index as well as the various currents and the behavior of the MJO.
Or we can wait for Japan to figure it out for us. They will.
Hi-- we've blogged before on…
Hi-- we've blogged before on alternative measures (which we monitor regularly). Regarding this event, the SOI is very negative right now (both versions, even the station based one). I honestly do not see any issues with the tropical response at this point and we are seeing what we need to see. Keep in mind the atmosphere will always be noisy (e.g. jump around from month to month) b/c it is susceptible to influence from MJO and other tropical 'weather.' This is why we prioritize the ocean based indices, which are more resilient to these influences.
Darwin, Tahiti Pressure Systems
Which reminds me - the Australian counterpart still has not declared that El Nino is here as of this fortnight even though the SOI is negative, the ocean has surpassed El Nino conditions and that they say there's a 70% chance of El Nino developing soon (El Nino Alert). Sounds like they're relying on climatology that's more recent compared to the old one (1991-2020 vs 1979-1998).
They say that the Tahiti pressure is close to average while the Darwin pressure is contributing to the El Nino like SOI.
Do you factor those two pressure systems when making the declaration of El Nino or La Nina on your side? Just curious whether if this needs to be looked at for future El Nino/La Nina declarations down the road.
We take in account the SOI…
We take in account the SOI in our decision making on ENSO status. Believe it or not even the BOM page says it's quite negative at the moment! However, it's important to keep in mind one of the reasons that the "traditional" SOI exists is b/c it was established well before the current era where we can measure SLP over the entire global oceans with reasonable accuracy. Back then they had to find two weather stations where they could measure ENSO! Given the lack of land sites in the Pacific, they picked Tahiti which is almost 20degrees latitude in the Southern Hemisphere. For this reason, we often rely on the newer "Equatorial SOI" which is located on the equator, arguably more central to ENSO dynamics. This index has been more firmly negative over the past several months. The traditional SOI still has its value (a long historical station based record), but for monitoring we also strongly consider the Equatorial SOI in addition to other atmospheric measures (precip/OLR/winds/etc).
Weather...it rains or not
The Southern Oscillation Index supports atmospheric conditions for the development of El Nino. Thus the increase in upper atmospheric temps and contributions of CO2, and O2 and BO. I am more concerned about the increase in sodium NA, in my McDonalds fries.
El Niño, Ecuador and Galapagos 1997-1998
The first official records of the phenomenon were reported by sailors and travelers. For example, closely related to the year 1891 and 1892, the Peruvian captain Camilo Carrillo in 1892 noticed the existence of a warm ocean current on the normally cold coasts of Peru and according to (Busiek, J. 2015) at the beginning of 1891, a traveler named S.M. Scott was staying near Talara, in northwestern Peru, recalling in a letter he wrote 34 years later how shocking it was to see clouds begin to form on the horizon:
“a low, thickly cloudy sky, intense heat, high humidity and an oily sea, so it began... The rain fell in inconceivable torrents for weeks... after dark, the sea burst in phosphorescent lightning along the coast ... If the sea was full of wonders, the land was even more so... the desert became a garden". He described "huge man-eating sharks" typical of the warm waters of Panama, bananas, coconuts, and snakes carried by the current, swarms of unknown insects in the air, and a parade of spiders entering his home (Busiek, J. 2015).
There are other interesting events associated with the most intense El Niño years. I found this on Wikipedia that between 1789 and 1793, the British historian Richard Grove reports that several observers of the time reported serious droughts in Asia, Australia, Mexico and southern Africa, for which reason it is suspected that this phenomenon could have caused the famine. that preceded the French Revolution. More recently, the meteorologist Jacob Bjerknes postulated in 1969 that El Niño is normally related to the Southern Oscillation, since a physical relationship is present between the phase of anomalous high pressure in the western Pacific with the phase of infrequent warming of the eastern Pacific, which is accompanied by a weakening of the trade winds from the east.
The Pacific coast of Ecuador does not suffer from hurricanes or tornadoes, which is one of the reasons why many North American sailboats from the Caribbean and Central America come to our beautiful port of Bahía de Caráquez and stay here for months. Your instruments are affected by all the electrical storms in those areas, damage that is, of course, aggravated by moisture. With our green season and our dry season, and with the influence of the warm Panama current (sometimes referred to as the El Niño current, since it arrives around Christmas time) and the cold Humboldt current, we have perfect weather year round. whole. We actually experienced what was formerly known as the El Niño Phenomenon, now called the El Niño-Southern Oscillation (ENSO) event or warm phase of the equatorial Pacific weather pattern as that scientists have understood that in reality this has been occurring with a certain periodicity over time.
This is how this afternoon in November 1997, when the rain from a North storm of almost 4 hours stopped, the streets on the bay side were flooded. This was a premonition of what was to come. The US Department of National Oceanic and Atmospheric Administration (NOAA) said the following: “Earth's climate is dynamic and varies naturally on time scales across seasons, decades, centuries, and longer periods of time. Each “up and down” fluctuation can lead to warmer or cooler conditions, wetter or drier conditions, with more or more inactive storms. Analyzes of climate records of decades or longer periods of time and studies based on climate models suggest that many of the changes in recent decades can be attributed to human actions: these trends in decades are called climate change. The effects of climate variability and change ripple throughout the environment and society – touching, in fact, almost all aspects of human activities and the environment. Perhaps the best-understood occurrence of climate variability is the naturally occurring phenomenon known as the El Niño Southern Oscillation (ENSO), an ocean-atmosphere interaction over the tropical Pacific Ocean that has major consequences for climate in all the planet. The ENSO cycle is characterized by strong and consistent variations in ocean surface temperatures, rainfall, air pressure, and atmospheric circulation throughout the equatorial Pacific. El Niño refers to the warm phase of the cycle, in which above-average sea surface temperatures develop in the eastern central tropical Pacific. La Niña is the cold phase of the ENSO cycle. Source: ENSO Cycle: Recent Evolution, Current Status and Predictions
The El Niño event of 1997 – 1998 was the strongest in recorded history. The damage to Ecuador was estimated at 2.8 billion dollars, 4 times more than that of 1982 – 1983. It was reported that the lives of seven million people in Ecuador had been altered in one way or another due to this extensive event. oceanic and atmospheric. The province of Manabí (where Bahía is located) was the most affected and due to some sort of current and atmospheric specificities, Bahía de Caráquez was the hardest hit city on the entire Ecuadorian coast. I think it was one of the most impacted by El Niño on the entire eastern coast of the Americas. The words “we have nothing, we have lost our house, our farmland and a family member” were heard frequently.
This El Niño came to us announcing thru bio-indicators that it was coming. What biological indicators were these? The thousands of seabirds that migrated to Peru looking for their food. It is known by the authorities of Peru that the anchoveta migrated to more than 120 meters deep, already making this unreachable for the diving of the Peruvian Boobies, Guanay Cormorant and other species, which can dive a maximum of 6 to 10m from the surface. Only in the month of May and June, according to data from the Ministry of Environment and Water, 8,000 dead specimens are known. They are machismo but almost certainly. For example, in the Bahía de Caráquez area, fishermen had never seen the southern cormorant from Peru (Cormoran guanay).
We always hope that the Humboldt current can do its job and especially cool the coastal profile of Ecuador. But today we have winter conditions on the beach, little wind and concern to start preparing for what we can mitigate, since it may be that a bad boy is only in his childhood stage. This event is currently projected to be a moderate to strong El Niño, the concern is that 40% of all the world's seas are overheated, will that have any consequences for the development of El Niño?
This is the million dollar…
This is the million dollar question. How will this El Nino impacts play out given the large amount of warmth over the globe? Keep in mind the IPCC has already stated that El Nino impacts are going to be influenced by climate change, in the sense that rainier areas may see more intensified rainfall (more moisture in air) and drier regions may be even drier (b/c of higher temperatures).
tri-modal sea surface temperature 'rachet'
and how will future El Nino episodes evolve as the baseline SSTs keep trending up. And does El Nino itself affect SSTs on longer time scales. The reason for bringing it up is the apparent trimodal distribution of SST shown on this climate reanalyzer page
https://climatereanalyzer.org/clim/sst_daily/
The cluster of traces approximately between the -2sigma and 1982-2011 mean lines cover the years 1982 to 2001.
The cluster of traces approximately between the mean and +2 sigma lines covers the years 2002-2014.
The years 2015 and later have all been above the +2 sigma line.
The transitions between these three regimes are not gradual as expected for a gradual trend. Instead there are jumps that leave gaps with few traces around the mean and +2 sigma lines themselves.
The 97/98 El Nino jumped up into the next regime but fell back until it became permanent in the 2001/2002 period.
The 2015 jump did stick with all subsequent years staying at an elevated level.
This year we are seeing what could be the next jump in the ratchet. Each jump has about a 2 sigma step size. Will it fall back after this El Nino episode is over or will it stick and become the new normal?
I wonder what causes these discrete regime changes leading to a multi-modal distribution. Have we seen enough of them to actually believe this is a pattern and, if so, are they triggered by large El Nino events?
Ratchet function
El Niño is overstated (oversimplified?) as a driver of global heating. It is not a cause nor effect of climate change.
Rather, El Niño along with La Niña are normal cyclical planetary oceanic (ENSO) phases, similar to the changing of seasons in the Northern and Southern hemispheres of Earth. Could we equate climate change to either hemisphere going into the summer or winter seasons? Not really, one hopes!
The causal link you're looking for to explain the "ratcheting function", likely has to do with greenhouse gas concentrations, constantly increasing, within a finite Earth atmosphere.
Again, a finite atmosphere - something we have yet to appreciate on a mass scale it seems. "Finitude" is difficult to grasp let alone deal with, when the prime social value across the globe is growth at all cost ("infinitude"). Oh mea culpa - I digress!
The "ratcheting function" is a question of how much solar energy is retained in Earth's finite atmosphere, vs how much energy can be reflected out.
Any resulting disequilibrium is the source of "ratcheting". ENSO and seasons are certainly not the culprit.
A Brazilian bio-indicator for strongs el nino
A bio-indicator of strong el ninos in the North of Minas Gerais - Brazil are the webs of small spiders in the pastures. Talking to the older ones, they said that in the years 72/73, 87/88, 97/98 and 2015/16 the pastures were full of these webs. This year they are present again. They are small spiders that make small holes in the ground and weave the web close to the ground between the grasses.
Rains were predicted for March and April but did not happen. The thing is ugly! there are already cattle dying in the region.
if 2015/16 is repeated we will only have considerable rain in January
God help us
Remanence of La Nina
Is there a " backlash " this Summer from the La Nina we had the past three years ? We have had a very stormy Summer here in the Ohio Valley and now NOAA came out today with an above normal forecast for Tropical Storms in the Atlantic. If El Nino is forming it looks like it will be late in the Winter or early Spring before the AMO phases negative and the PDO positive ?
ENSO impacts are very weak…
ENSO impacts are very weak over North America during the summer months. Many of the extremes we are seeing over the U.S. are probably not El Nino.
So is the Southeast going go get cold?
I'm in South Carolina and wondering is ElNino going to bring us cold and more winter like weather 2023 into 2024 or not.. I hope so
You can find CPC's seasonal…
You can find CPC's seasonal outlooks for temperature and precipitation here. At this point, for South Carolina, it looks like odds favor above-average precipitation and "equal chances" for temperature (another way of saying we don't know b/c of the lack of strong signals).
anonymous
That was a full day of classes! School dismissed
Baja and Sea of Cortez
What are the likely wind and weather effects in the Sea of Cortez? Last season we saw a very late arrival of the traditional February southerlies (didn't really arrive until April). Could this happen again this winter? Any other significant concerns in the Sea???
Last winter we were coming…
Last winter we were coming out of La Nina, and this winter, it looks likely to have El Nino. I'm not sure what the regional wind patterns are like in that region, but I would expect opposing signals between El Nino and La Nina.
ENSO / neutral
We are currently in an ENSO / neutral Summer pattern, which results in a very wet upper South. The High Pressure Ridge to our West is locally forecast to move East and shut the rain and storms off, and give our area a Heat Wave next week ?
El Nino not developing much from last month as it's shown on the real time map compared to the anomaly map, which is overblown in my opinion. I don't want a Winter with a split flow anyway.
El Nino
Seems to me El Nino is developing quite well now. SSTs in the Nino 3.4 are currently at 1.2C and rising. That sustained temp would lead to a moderate El Nino but all the models I've looked at show temps at least at 1.5C which would be a strong event,
In our last update we said…
In our last update we said there was a 2 in 3 chance of a 3 month average value (e.g. November-January) that is in excess of 1.5C. So we agree!
Forecasting an El Nino event
What method did NOAA use to forecast this Fall and Winter El Nino event ? What makes me question this is on NOAA's current SST chart it is showing SST's off the coast of Lima, Peru in the upper 60's to 70 degrees F.
El Nino
Not sure what the SST's off the coast of Lima Peru have to do with forecasting ENSO events. Right now the SSTs in the Nino 1.2 are on fire with very warm temps. The staff are experts and look at a number of different things. One of those things are the SST models that forecast SSTs in the Nino 3.4 regions. There are a suite of models. The NMME model and IRI/CPC blend models to come up with an average. At least my experience with these models are they are good at forecasting ENSO events. Almost all of them are forecasting SSTs at or above 1.5 degrees which would be considered a strong El Nino. As of today the SST in the Nino 3.4 region is 1.2 degrees and climbing so it does look like a strong event is likely.
Chance of Very Strong El Nino?
Thanks for the very interesting blog.
In the July blog you noted:
El Niño will peak with a maximum Niño-3.4 Index of at least 1.0 °C, a 50% chance of at least 1.5 °C, and a 20% chance of above 2.0 °C
Can you provide an update on the chance of above 2.0 C (and/or a link to the forecast probabilities that include that category)? I could only find the following which only shows divisions up to >1.5 C.
Climate Prediction Center - El Nino Southern Oscillation (noaa.gov)
El Nino above 2.0
My guess is the odds of an event topping 2.0 is decreasing. Even the normally aggressive CFSv2 model appears to be backing off on that forecast
https://www.cpc.ncep.noaa.gov/products/people/wwang/cfsv2fcst/imagesInd…
The August outlook had about…
The August outlook had about a 30% chance of this El Nino peaking above 2C. We'll have to see what the September outlook predicts when it comes out on the 14th
Where is the El Nino rains
Living in Arizona my recollections of this event were heavy rainfall by this time of year, something that was welcomed. This summer has been a dud as far as rain, can we look forward to more coming or is the answer simply unknown.
El Nino and Arizona rains
El Nino typically does not have a significant influence on Arizona precipitation until later in the year, particularly the winter. As shown in Tom's most recent post, the precipitation pattern over the Pacific/North America region this past summer was remarkably consistent with the expected El Nino precipitation pattern. Emily wrote about the North American monsoon a couple of years ago, suggesting that there may be a weak relationship between ENSO and the North American monsoon (hence Arizona precipitation in the warm season), but the connection looks pretty weak.
Comments have been disabled on this article