Blogs
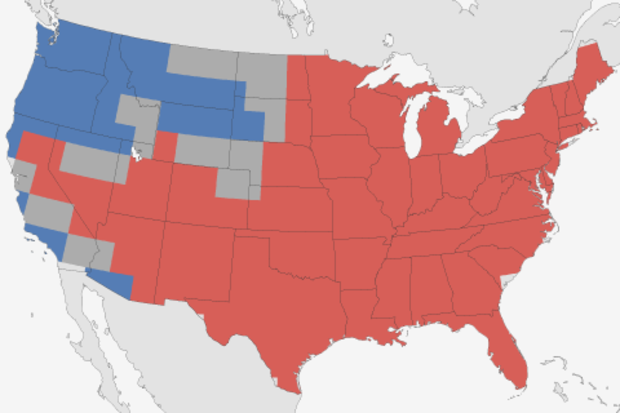
When it comes to the Winter Outlook, there are two equally important blog posts here at the ENSO Blog. The first, obviously, is the actual post on the winter outlook describing what exactly we, at the Climate Prediction Center, were thinking when it came to temperature and precipitation for winter. But we shouldn’t overlook the second post. The one where we look back upon that forecast and say “So… how’d we do?”
So…now that winter’s officially over, how’d we do?
“It’s tough to make predictions, especially about the future”
When Yogi’s right, he’s right. The Winter Outlook, issued in November for December-January-February, looked a lot like what you expect during a La Niña …
Read article
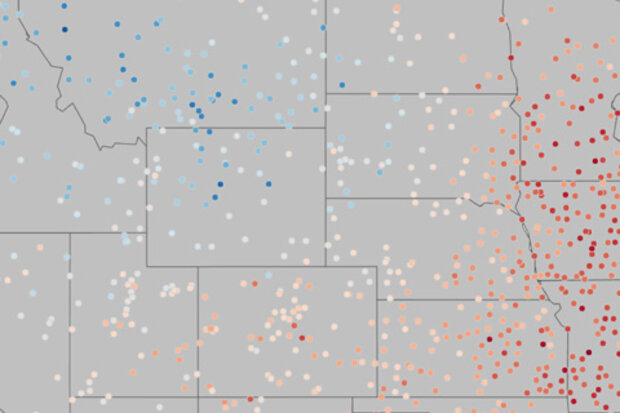
Recently, the National Centers for Environmental Information (NCEI) identified February 2017 as the second-warmest February on record for the contiguous United States (CONUS). According to NCEI’s report, the CONUS average temperature for the month of February was 41.2°F. Compared to the twentieth-century average (1901-2000), the CONUS was 7.3°F warmer than average, indicating February 2017 was an abnormally warm month.
The same can be said for January 2017, with a CONUS average temperature of 33.6°F, which is 3.5°F above average. The warmer than average temperatures so far this year have already led to an early blooming period in the southern and eastern parts of the United States.
…
Read article
With La Niña in the rear-view mirror, forecasters expect that neutral conditions will continue through the spring. After that, there are increasing chances of El Niño making an appearance, but they’re still not very strong chances—around 50% by the late summer, but not quite at the point to warrant an El Niño Watch. What’s behind this verdict?
Pre-trial briefing
First, a quick review of the recent facts. Sea surface temperatures in the Niño3.4 region (our main region for monitoring and predicting ENSO) were close to average during February, measuring -0.15°C below average in the ERSSTv4 dataset, and +0.14°C above average in the OISST dataset. These two datasets have different input and…
Read article
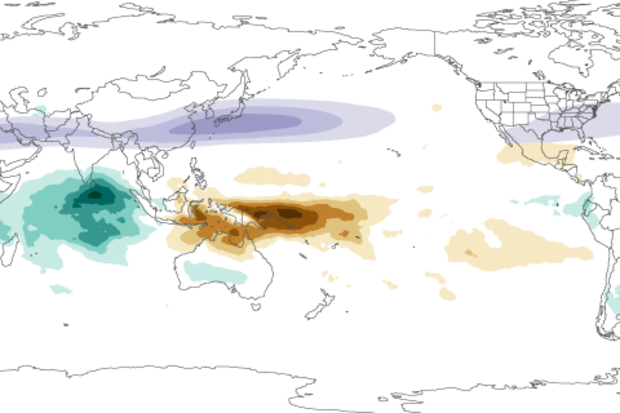
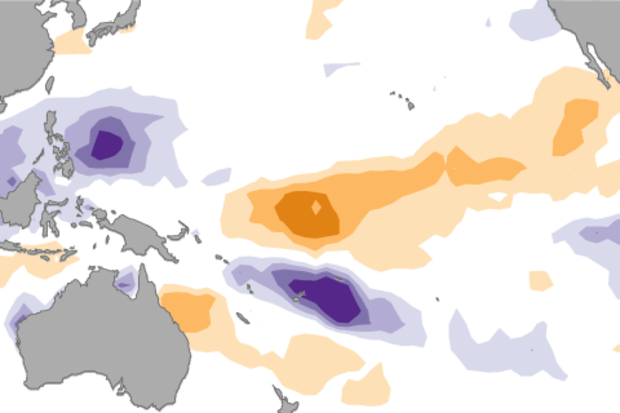
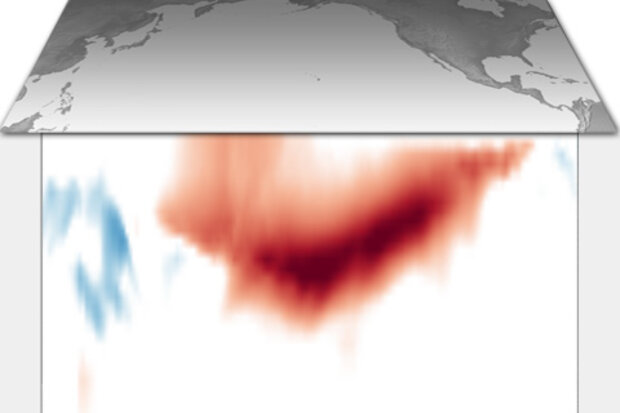
The United States has experienced some intense weather patterns lately, including flooding in California and a Nor’easter in New England. We can’t trace these back to a butterfly flapping its wings on the other side of the world, but we can connect them to tropical rainfall patterns that seem just as far away.
The tropical Pacific and Indian Oceans have some of the warmest oceans temperatures in the world. They provide plenty of heat and humidity for heavy rain and thunderstorms — storms that are so strong they can change global wind patterns and affect weather around the globe. El Niño and La Niña are the best-known examples of how shifts in those rainfall patterns can have global effect…
Read article
This is a guest post by Dr. Aaron Levine who is a National Research Council postdoctoral associate at the NOAA Pacific Marine Environmental Laboratory. His research is on ENSO dynamics and predictability, and focuses on how changes in weather (or what is often referred to as “noise” in climate studies) influence the evolution of ENSO.
While you can’t set your watch to El Niño or La Niña because it occurs irregularly and sometimes with little warning, when one does emerge it is strongly linked to the calendar month. Typically, events peak during the Northern Hemisphere winter and then weaken or disappear during the spring or summer (1). In part because ENSO is transitioning, the spring is …
Read article