Blogs
We’ve been going Beyond the Data for a year and a half now (time flies!). Sometimes, on a long journey, it’s good to revisit the basics. What got us here?
That’s the theme for this edition. We’re going old school, and just look at some good old climatology adages and truisms, through the lens of a sturdy, reliable warhorse of a dataset.
One question that we get here at NCEI’s Center for Weather and Climate, more so than you might think, are questions about superlatives. “What is the hottest place in America?” and so on. I call these the “Mostest Questions.”
To respond to these recurring questions, we set up a handy viewer that helps describe just that. Today’s edition of Beyond the …
Read article
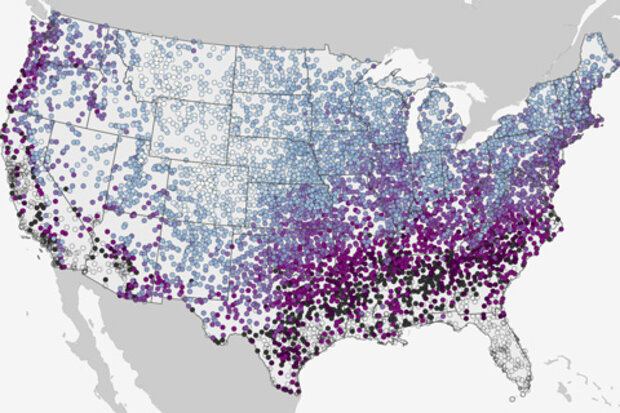
Near the anniversary of Beyond the Data's most popular post, we've given the map an interactive upgrade. Click to zoom in on an area of interest and drill down to see the date by which the chances for the first snow of the season at your location rise to at least 50%. Will this year's first snow come earlier or later than the historic "first date" of snow? See what the climate record has to say and keep up with your local forecast.
This map shows the historic date by which there’s a 50% chance of at least 0.1” of snow on the ground, based on each location’s snowfall history from 1981-2010, based on the latest U.S. Climate Normals from NOAA's National Centers for Environmental Informat…
Read article
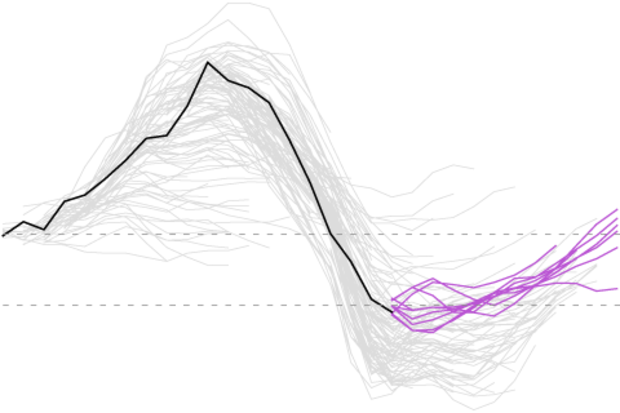
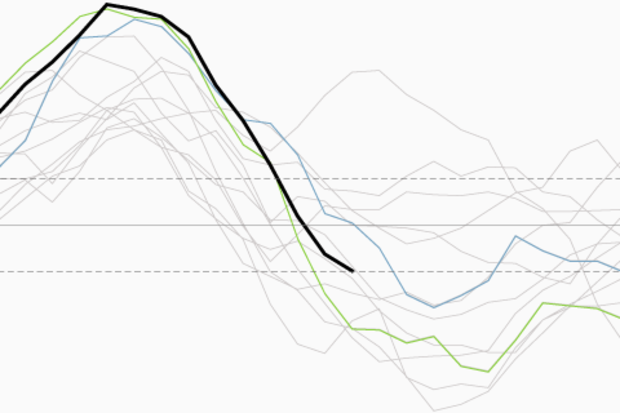
I’m back with yet another GIF animation because I think I’ve developed a mild addiction to them [Editor’s note: that’s a classic denial by a serious addict]. Words mean one thing, but movies, well, they can reveal a lot. In this case, we wanted to show you every single North American multi-model ensemble forecast for ENSO over the past year and a half. This does not include every model that forecasters consider when developing their consensus outlook, but it includes a lot of them.
This particular animation displays once-a-month data of sea surface temperature departures averaged in the Niño-3.4 region in the equatorial Pacific Ocean, which is one key location to monitor ENSO…
Read article
Since the demise of the big 2015-16 El Niño in April, the tropical Pacific has been loitering around in neutral… and now forecasters think it’s likely to stay that way through the winter. For now, we’re taking down the La Niña Watch, since it no longer looks favorable for La Niña conditions to develop within the next six months.
What happened?
Over the last few months, sea surface temperature anomalies (the departure from the long-term average) in the Niño3.4 region have become more negative, which was expected. Currently, the sea surface temperature in the Nino3.4 region is about -0.5° below the long-term average, according to the ERSSTv4 data.
This is the La Niña …
Read article
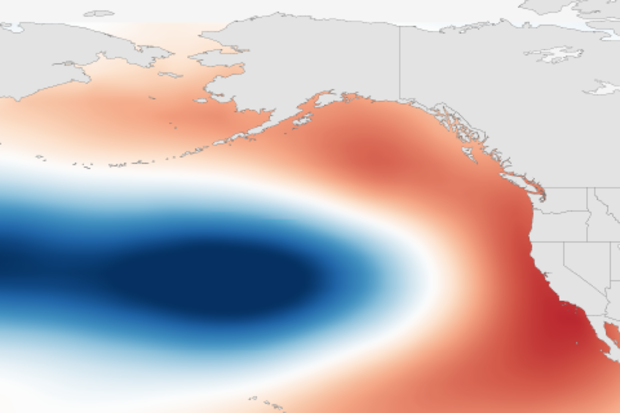
We talk a lot about El Niño and La Niña at the ENSO blog, but there are other phenomena that garner interest among scientists, even if they do not have the same brand recognition as El Niño. So while we wait for a potential La Niña (forecaster checks watch), this blog post will take us on a first date with a sea surface temperature (SST) pattern in the North Pacific Ocean called the Pacific Decadal Oscillation or the PDO. (Tony already provided our meet cute with the PDO.)
First identified in the late 1990s (Mantua 1997), the PDO is the most significant year-round pattern in monthly SSTs across the North Pacific. Similar to ENSO, the PDO has two states – warm and cold – and involves vario…
Read article