Blogs
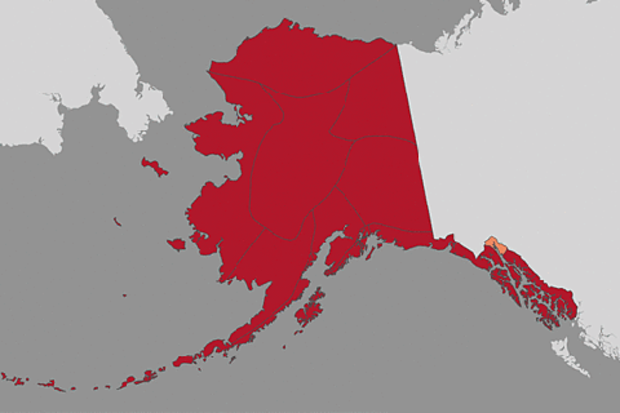
This week, NOAA’s National Centers for Environmental Information (and several other institutions) reported April 2016 to be the warmest April on record for the planet. If broken temperature records seem to you like, well, a broken record, you’re onto something: all of the last twelve months now hold the “Warmest [INSERT MONTH HERE] on Record” title. That’s twelve months in a row, and that’s never happened.
But that global average is just that: an average. Each month—even the warmest ones—bring pockets of cold. Conversely, they also bring regions that are colossally warm. This is true over time, too. In recent decades, as month-to-month weather fades into a clearer signal of climate, regio…
Read article
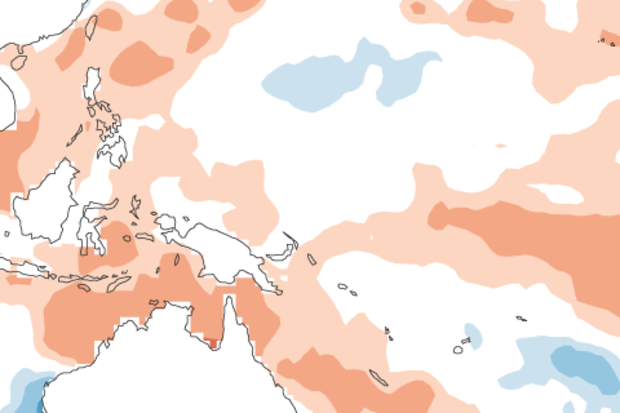
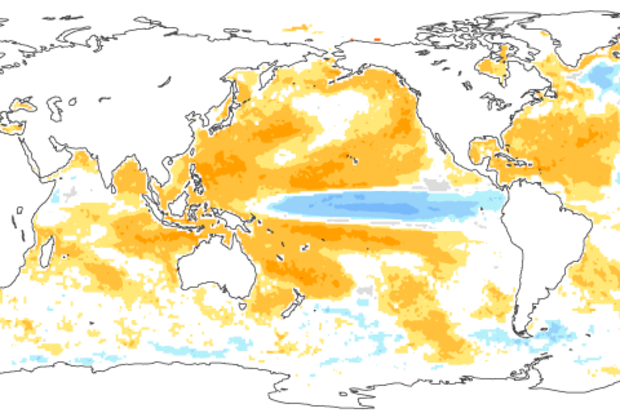
There’s a 75% chance that La Niña will be in place by the fall, meaning sea surface temperatures in the central Pacific at the equator will be more than 0.5°C below average. It’s possible the transition from El Niño to La Niña will be quick, with forecasters slightly favoring La Niña developing this summer. What’s behind this reasonably confident forecast?
Current conditions
Sea surface temperatures in the Nino3.4 region, our primary index for ENSO (El Niño/Southern Oscillation), have been cooling steadily since they peaked at 2.4°C (4.3°F) above average back in November. Recently, cooling has accelerated, and April was 1.2°C above average using ERSSTv4, our most historically consisten…
Read article
This is a guest post by Dr. Amy Butler (@DrAHButler) who is a research scientist at the University of Colorado Cooperative Institute for Research in Environmental Sciences (CIRES) and sits within the NOAA Chemical Sciences Division (CSD). Her research focuses on large-scale climate patterns and phenomenon, such as the Arctic and Antarctic Oscillations and sudden stratospheric warmings.
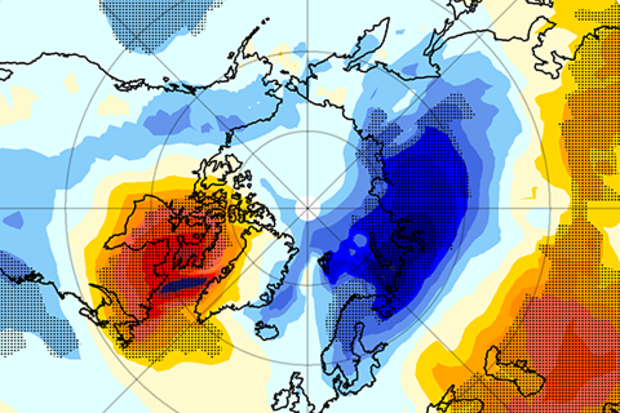
“’Polar vortex’ set to strike the U.S. as snowstorm death toll rises” (Slate). “Polar vortex transforms Mid-Atlantic to Mid-Antarctic” (Washington Post). “Economic impact of ‘polar vortex’ could reach $5B” (CBS News). These are all real headlines from 2014 and 2015, when the phrase “polar vortex…
Read article
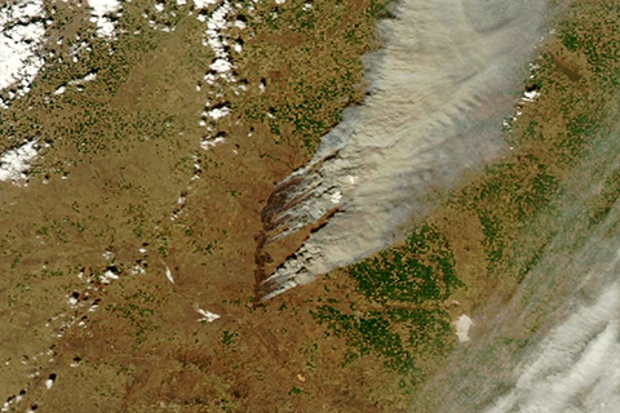
Welcome to Beyond the Data. This week, we’ll talk a little bit about wildfire. Specifically, prairie fire.
Before we do that, I hope you don’t mind if I take a second to process a couple of facts about March 2016. First, that the world’s land areas averaged 4.2°F warmer than the month’s 20th century average. Second, compared to March’s 1981-2010 “normal,” the Northern Hemisphere’s combined area of “missing” sea ice and snow cover would cover more than a tenth of the moon.
(stunned silence) Whoa.
Now let’s talk about the prairie
In our previous entry, we visited a little bit about 2016’s very warm start across the United States, and the regional pockets of very dry conditions amon…
Read article
It will soon be time to bid good-bye to the strong El Niño of 2015-2016. Forecasters anticipate that sea surface temperatures in the Niño3.4 region will drop below the El Niño threshold (0.5°C above the long-term average) in the late spring or early summer. After more than a year of El Niño conditions, what’s next?
First, though—what’s now?
The average anomaly (departure from average) in the Niño3.4 region during March still reflected a strong El Niño, at 1.6°C in the ERSSTv4 dataset. However, this was a substantial drop from February’s 2.0°C, which is what we’d expect during the demise of an El Niño.
The atmosphere was still responding to those warmer-than-average El Niño surfa…
Read article
