El Niño means an even floodier future is on the coastal horizon
This is a guest post by Dr. William Sweet and colleagues Dr. Greg Dusek, Dr. John Callahan, Analise Keeney and Karen Kavanaugh with NOAA’s National Ocean Service who are advancing the science and services to track and predict coastal flood risk in the face of sea level rise.
Flooding of U.S. coastlines due to sea level rise is a reality, plain and simple. This is referred to as high-tide flooding, and it’s distinguished from flooding caused by crashing waves or extreme rainfall. High-tide flooding in the U.S., which is measured by NOAA tide gauges that continuously record surrounding water levels (1), occurs nearly three times as often today as it did in 2000, and the frequency is accelerating along most Atlantic and Gulf Coast locations. Flooding that used to happen only during big storms now happens for a variety of reasons: a stiff onshore breeze, slowing of the Gulf Stream, a Hawaiian eddy or a full-moon tide. Also, as we discuss below, ENSO (El Niño/Southern Oscillation, the entire El Niño and La Niña system) has an important effect on coastal flooding.
High-tide flooding varies by region, but usually occurs when water levels reach at least 1 to 2 feet higher than average high tide (2). More frequent high-tide flooding is converting saltmarshes to mudflats, changing coastal ecosystems, infiltrating groundwater, degrading storm and wastewater systems, flooding streets, and slowing commutes and commerce alike. In short, our critical infrastructure and natural resources are in the tide’s way, and the tide is not backing down!
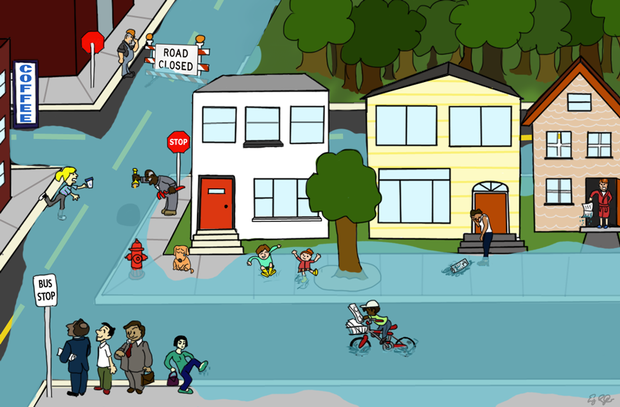
Nuisance flooding impacts may not be life threatening, but they can disrupt transportation, damage infrastructure, and strain city and county maintenance budgets. Due to sea level rise, the frequency of high-tide nuisance floods are rapidly increasing along U.S. coasts. Cartoon by Emily Greenhalgh.
But you can prepare!
Due to the cumulative toll of high-tide flooding, the effort and cost of response are an increasing burden on communities. Until lasting comprehensive solutions are put into place to protect communities from rising seas, guidance for the next year will become ever more important (think annual emergency-response budgeting). Since 2015-16, when the last strong El Niño occurred, NOAA has been providing an annual and seasonal coastal flood outlook to give coastal communities guidance about what they are likely to experience in terms of coastal flooding in the coming year. (Check out footnote 3 for some additional background.)
How does ENSO factor into these coastal flood outlooks? El Niño in particular can really kick things up, because sea levels are already so close to the brim in many communities thanks to climate change. History shows that during El Niño, flooding occurs along many U.S. coastlines even more frequently (see figure below for a comparison of high-tide flooding with El Niño and without El Niño). In contrast, La Niña tends to decrease or have no effect on high-tide flooding frequencies in many regions. Thus, the El Niño that recently emerged is the leading cause of higher predictions above and beyond the trend imparted by sea level rise itself in the 2023/2024 NOAA Annual High-Tide Flooding Outlook. This is a change from the last several years when we were in La Niña.
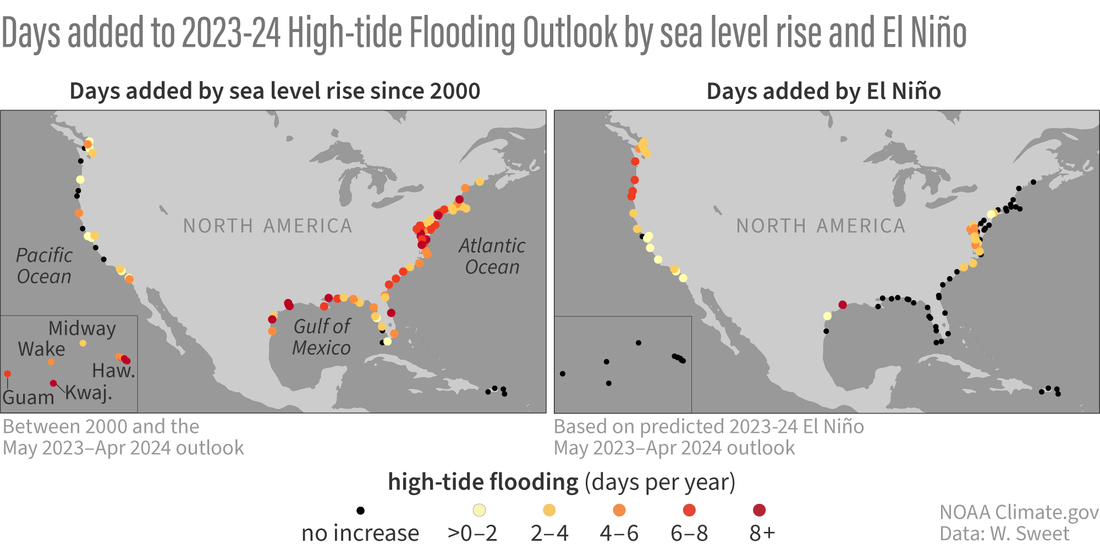
(Left) The additional number of high-tide flooding days in the 2023-24 Outlook, relative to the year 2000 average, attributed to rising sea level trends. (Right) Additional number of high-tide flooding days above and beyond those from sea level rise, shown in the left panel, based upon the predicted 2023-24 El Niño with a 9-month average Oceanic Niño Index (ONI) value of 1.2° C (see footnote #6 for how this was determined). For additional details on how the attribution is calculated, please see Sweet et al. (2018). NOAA Climate.gov graphic, adapted from original by Billy Sweet.
Beyond the brim from coast-to-coast
So how does El Niño increase high-tide flooding on both U.S. coastlines? Briefly, El Niño effects tend to increase the number of high-tide flooding days during the Northern Hemisphere’s cool season (roughly October to April – the reason why the annual outlook follows a May-April meteorological year definition) by reinforcing the seasonal processes that cause high-tide flooding in the first place.
First off, El Niño causes a regional rise in sea levels and thus higher-than-normal spring (full or new moon) tides along the U.S. Pacific and Atlantic coastlines. Along the equator in the Pacific Ocean, El Niño weakens the typical east-to-west surface winds (i.e. a weakening of the Walker circulation), which triggers eastward propagating equatorial Kelvin waves, spreading warmer-than-average ocean temperatures into the eastern equatorial Pacific Ocean. Once these waves traverse the entire equatorial Pacific, they hit the South American coast, splitting north and south along the Pacific coastlines. These waves that travel along the coasts are called “coastal Kelvin waves” and these warmer waters elevate sea levels along the U.S. West Coast for several months at a time, often equal to a decade’s worth of sea level rise.
In addition to processes rooted in the ocean, El Niño can raise sea levels on both coasts by changing atmospheric pressure patterns in both the North Pacific and North Atlantic. These pressure patterns modify the winds, helping to pile up the water along the coasts even more (4).
Also, El Niño affects regional storm frequencies of both midlatitude storms (e.g., nor’easters) and hurricanes. Because of the large-scale atmospheric circulation anomalies caused by El Niño, the North Pacific subtropical west-to-east jet stream shifts farther south and is more elongated in the west-east direction across the southern U.S. This tends to bring more water vapor and storms than normal along the California and Mid-Atlantic coastlines. On the other hand, these conditions generally suppress tropical storm activity within the Atlantic basin (5), but in the end, the scale is still tilted toward higher overall storminess (and effects like beach erosion) along the U.S. East and West coasts during El Niño.
So, to summarize, the increase in high-tide flooding during El Niño is due to a combination of higher sea levels and over-riding high tides plus regional storminess increases (and storm surges). Dr. Ben Kirtman also previously provided a guest post on some related research if you want to check that out.
Breaking down the Outlook
Let’s not forget, though, the reason high-tide flooding is becoming more noticeable and impactful to begin with is decades of sea level rise. Just how does the impact of long-term sea level rise on the 2023/2024 High-Tide Flooding Annual Outlook frequencies compare with the expected impact of the predicted El Niño? The maps below give us the answer.
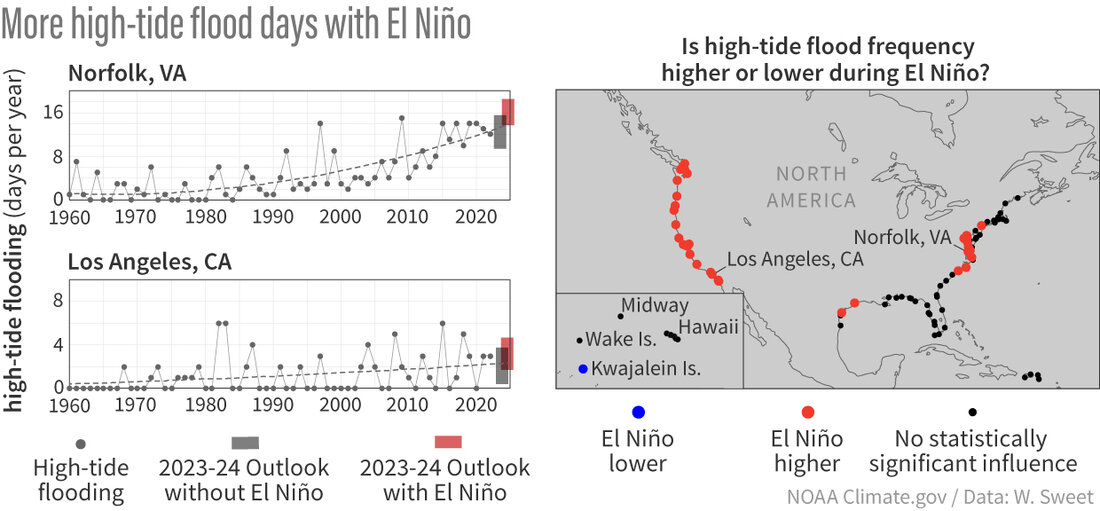
(Left) Graphs of number of high-tide flooding days per year (gray line and dots) from 1960 through 2022 from NOAA tide gauges in Norfolk, Virginia (top), and Los Angeles, California, (bottom). The gray dashed line shows the long-term increasing trend (note the accelerating trend in Norfolk). The gray shading at the end of the time series indicates the likely range of values that would be predicted for 2023-24 based solely on extrapolating the long-term trend. The red shading indicates the official 2023-2024 Hide-Tide Flooding Outlook, which provides the ‘likely range’ of high-tide flooding days over the course of the year. The higher number of predicted flood days in the official outlook relative to the extrapolated trend reflects the expected effects of the predicted moderate-to-strong El Niño through the upcoming winter. (Right panel) Locations where El Niño influences annual high-tide flooding frequencies. Black dots represent locations with no statistically significant influence. Note that the El Niño influence varies slightly both spatially and through time, but not much--see previous NOAA High Tide Flood Outlook reports (listed in footnote 3). NOAA Climate.gov image, adapted form original by Billy Sweet.
Because the rates of long-term sea level rise differ between the U.S. Pacific and Atlantic Coasts, the relative effects of the current El Niño are also expected to differ between the two coasts:
- Along the U.S. Pacific Coast, where the rate of sea level rise is lower than along the Atlantic Coast, 3 to 8 days of high tide flooding are predicted in 2023/24, with the currently predicted El Niño (6) expected to have three times more influence on the increase relative to the year 2000 than long-term sea level rise (roughly 3 additional days due to El Niño and 1 additional day to sea level rise).
- Along the U.S. Atlantic Coast, in contrast, the faster long-term sea level rise leads to higher predictions of high tide flooding in 2023/24, ranging from 9-14 days, and the predicted El Niño accounts for up to half of the overall increase relative to the year 2000, particularly in the Mid-Atlantic region (again, roughly 3 additional days due to El Niño but here 6-7 additional days to sea level rise).
Whatever happens, now is a good time to evaluate local vulnerabilities and begin preparing for high-tide flooding predicted to occur this coming year. In addition to the Annual Outlook, NOAA provides many other resources designed to provide communities with guidance on high-tide flooding from hours to decades (footnote #7) that can be combined with NOAA maps to illustrate, contextualize, and begin to assess overall flood risk.
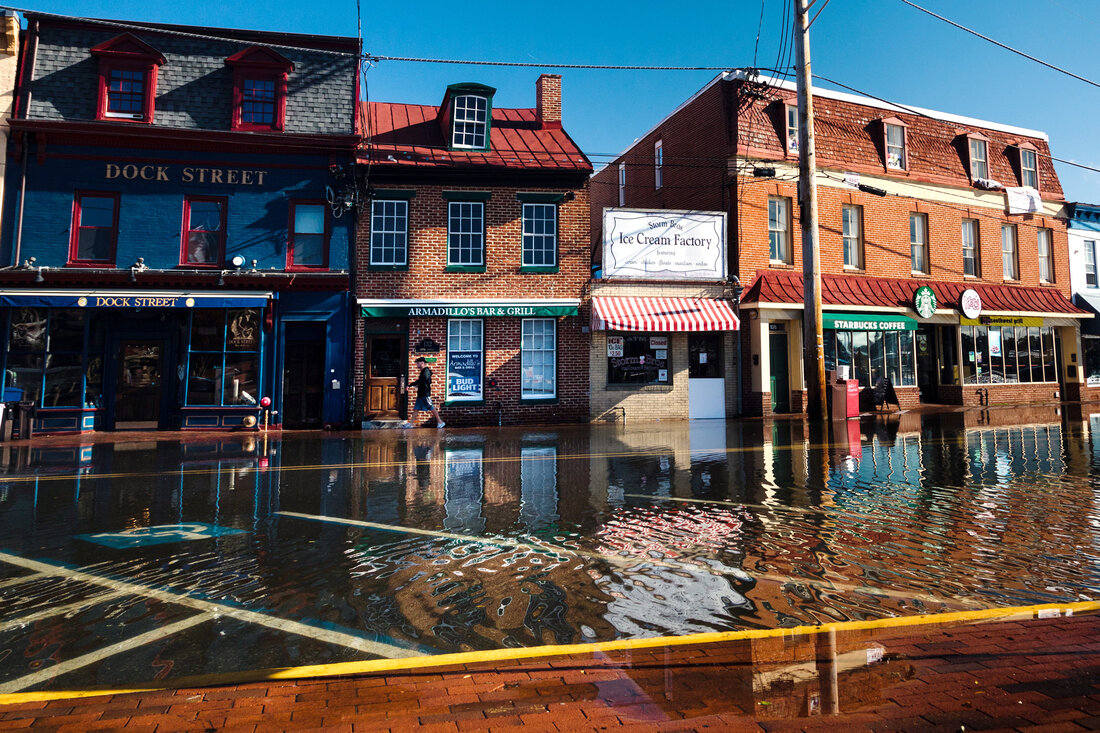
High-tide flooding on October 24, 2017, submerged roads and parking areas along Dock Street, in the historic heart of Annapolis, Maryland. Photo by Will Parson, Chesapeake Bay Program. Used with permission.
What else is being done?
In addition to existing products and reports on sea level rise and coastal flooding, NOAA and its Federal partners are actively working to improve our seasonal to annual predictions of sea levels and high-tide flooding through funding from the Bipartisan Infrastructure Law. Efforts center around incorporating dynamical atmosphere-ocean coupled models, advanced statistical and machine learning models, and hybrid approaches to better prepare coastal communities for what will happen tomorrow, next season, next year and beyond.
Lead Editor: Nat Johnson (NOAA)
Footnotes
- For those of you who care about the details: tide gauge measurements typically do not include effects from wave runup and overland rainfall due to their sampling scheme and harbor placement.
- More specifically, a high tide flood is counted when the tide gauge-specific minor flooding height threshold is exceeded.
- Some additional references that provide the history and basis for the NOAA Annual High-Tide Flood Outlook:
- Sea level rise and nuisance flood frequency changes around the United States, Sweet et al, 2014.
- Patterns and projections of high tide flooding along the U.S. coastline using a common impact threshold, Sweet et al, 2018.
- See 2015-2021 Annual ‘High Tide Flooding’ Report Series under the ‘Popular Publications’ tab at https://tidesandcurrents.noaa.gov/pub.html
- The atmospheric pressure patterns caused by El Niño, often called “teleconnection patterns,” impact sea levels on both coasts in different ways. On the West Coast, El Niño tends to cause lower-than-average air pressure over the North Pacific Ocean and Gulf of Alaska (a stronger-than-average Aleutian low pressure center), which brings anomalous south-to-north winds along much of the West Coast. Because water that gets pushed by the wind moves to the right of the wind direction (in the Northern Hemisphere), the water driven by the anomalous south-to-north winds gets pushed toward the coastline and has nowhere to go but down. That means there is a reduction in the the coastal upwelling along the West Coast that normally brings the cool subsurface waters up to the ocean surface. On the East Coast, the anomalous pressure patterns over eastern Canada and the North Atlantic Ocean tend to shift the prevailing west-to-east winds along the Northeast U.S. coastline to more of a northwest-to-southeast heading. Again, because water gets pushed to the right of the wind direction, this increase in the north-to-south component of the wind likely causes some reduction in overall eastward transport off of the U.S Northeast coastline, leading to higher-than-normal U.S. Northeast Atlantic sea levels (check out this study for more of the details).
- It’s worth noting that the suppression of Atlantic tropical cyclones by El Niño could be offset and even overwhelmed by the effect of an unusually warm Atlantic Ocean, as indicated in NOAA’s recently updated Atlantic Hurricane Season Outlook. Of course, hurricane landfalls can cause catastrophic flooding – much more severe than most high tide flooding events.
- Specifically, this assumes a 9-month average Oceanic Niño Index (ONI) value of 1.2°C, as determined from the “all-model” average in the June 2023 IRI ENSO Predictions Plume when the Outlook was made.
- Specifically, feel free to check out ‘now and near’ guidance (Coastal Inundation Dashboard), flood likelihoods for specific days in the next few months (Monthly Outlooks) and longer-term Decadal Projections (toggle between annual and decadal) of HTF frequency out to 2100 based on 2022 Interagency Sea Level Rise Task Force’s/National Climate Assessment’s Sea Level Rise trajectories and scenarios.
Comments
Thanks
I don't live anywhere near the coast, so this will not affect me. However, I thought this was an interesting and educational post. So, thanks for this objective and informative analysis.
Good research - but please, do not focus only on the US
thank you very much for this in-depth research on high-tide-flooding increased by El Niño in the US.
However, the impact of El Niño will be even harder in other countries, particularly Centralamerica, the Andes and Northeast Brasil. High quality and localized research for these region is still ver y poor. You could change this.
Greetings from Bogota, Colombia.
Comment and Question
I've been hearing this for over 60 years and nothing has happened in the way of flooding coastal cities. I'm getting sick and tired of hearing this nonsense " Climate Change. "
When is your next update on ENSO ?
If you think that "nothing…
If you think that "nothing has happened in the way of coastal flooding" over the past 60 years, I can only conclude you are not familiar with the actual data on this.
NOAA has a long record of data from tide gauges all around the coastlines of the U.S. And that data shows unequivocally that rising sea level is causing more days of high-tide, aka "nuisance," flooding. Let me take you on a tour, courtesy the Climate Explorer in the U.S. Climate Resilience Toolkit, to...
Bar Harbor, Maine
...where between 1960 and 1990, there were only 4 years with more than 5 days of high-tide flooding, while between 1990 and 2020 there were 14 such years; this increase is despite the fact that ice-age rebounding of the land there is partially offsetting the impact of global sea level rise!
And then southward to...
Boston, Mass.,
...where between 1960 and 1990, there were only 2 years with more than 5 days of high-tide flooding, while between 1990 and 2020 there were 13 such years.
And then southward again to...
Sandy Hook, NJ,
...where from 1960-1990, there was a grand total of 1 year that had more than 5 days of high-tide flooding, while from 1990-2020, there were 16 such years.
Norfolk, VA,
...where before before 1990 there wasn't a single year with more than 5 days of high-tide flooding, but since then there have been 18 such years...
Carrying on around the coast to the Southeast and Gulf, we find...
Wilmington, NC--
...where before 1990, there were 2 years with any amount of high-tide flooding (1 day in 1987, and 1 day in 1954), but since then there have been 10 such years.
Fort Pulaski, GA
...where before 1990 there were zero years with more than 5 days of high-tide flooding, but since then, there have been 8 such years.
Galveston Pier, TX
...where prior to 1990, they had never recorded a year with more than 5 days of high-tide flooding, but since then, they've had 11.
If i kept going around the coast, the increases would get smaller because local land processes do more to offset global sea level rise on the West Coast than they do on the East Coast. But the overall national trend is crystal clear.
I'm glad you appreciate the ENSO blog, but science is science, and data are data, and here at Climate.gov, we cover it all. Sea level rise and increases in coastal flooding are real, and communities all around the country are facing their impacts. When that topic intersects with ENSO, you're going to find us talking about it here on the blog.
If you'd like to learn more about how and why the rates of sea level rise vary from place around the U.S., this interactive map should be useful. If you'd like to learn more about projected increases in high-tide flooding with future warming of difference amounts, visit the U.S. Climate Resilience Toolkit.
El Nino, LA Nina
Are the huge rainfall experience in Chile El Nino related?
Thanku for this
Really amazing and in depth research
Comments have been disabled on this article