Winner or bust? Did La Niña shape North American precipitation this winter as expected?
While many of us in the U.S. are reveling in the excitement of college basketball tournaments and trying to win our March Madness pools, it’s also a good time to look back at this past winter’s (December 2024– February 2025) precipitation pattern over North America. Were the seasonal forecast models a winner or a bust this winter? Was La Niña a star or a benchwarmer? Let’s go to the videotape!
Pre-Season polling
Early last December, I wrote about the predicted winter North American precipitation pattern from a group of state-of-the-art computer forecast models, the North American Multi-Model Ensemble (NMME). At that time, I argued that the forecasted precipitation pattern was consistent with at least a moderate-strength La Niña even though the forecast of sea surface temperatures reflected a weak La Niña by our traditional measures. So, what actually happened this winter?
We, in fact, did observe weak La Niña conditions, reflecting cooler-than-average ocean temperatures in the east-central tropical Pacific. These anomalous tropical Pacific conditions tend to alter the global atmospheric circulation in known ways. For the U.S., the most important is a northward shift of the Pacific jet stream and the prevailing storm track. Storms are deflected toward the northern part of North America, keeping southern North America drier than average.
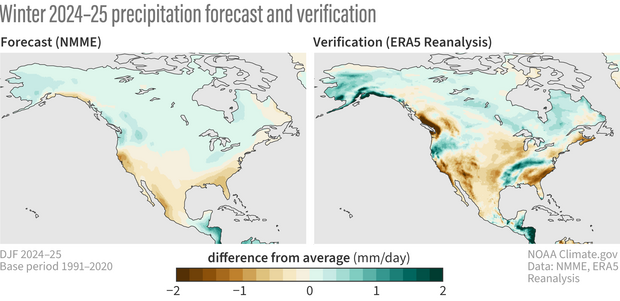
(left) The precipitation forecast for this past winter (Dec-Feb 2024-25) based on the average of all the individual models in the North American Multi-Model Ensemble forecast system produced last fall (Sep-Nov 2024). (right) The actual precipitation pattern that occurred this past winter from ERA5 Reanalysis, expressed as the difference from the 1991-2020 winter average. NOAA Climate.gov image, based on analysis by Nat Johnson.
As the maps above show, both the average model forecast and the observed winter precipitation pattern bore the telltale signs of a La Niña influence. In particular, most of the southern U.S. and northern Mexico were predicted to be and turned out to be drier than average, with record-dry conditions in southern Arizona and parts of New Mexico. Wetter conditions were forecasted and did prevail over the northern part of the continent, particularly in Alaska and parts of the Pacific Northwest, as well as much farther south in Central America.
As is usually the case in any given winter, there also were some notable differences from both the computer model forecasts and the expected La Niña influence (some impacts did, as we wrote earlier, “bust!”). Most conspicuously, British Columbia was much drier than average, and a ribbon of wetter-than-expected conditions extended northward and eastward from east Texas, Arkansas, Kentucky, and western Virginia. Despite these regional differences from expectations, the big picture was pretty La Niña-ish overall.
So, the fingerprints of La Niña are pretty clear on this winter’s precipitation pattern. A second question is whether this influence was more consistent with a moderate-strength La Niña or a weak event? First, let’s review why this event may have packed a bigger punch than the “weak La Niña” label would indicate.
Warm tropics: transforming La Niña from sleeper to favorite?
Traditionally we monitor the strength of El Niño or La Niña with the surface temperature in the so-called Niño-3.4 region of the east-central tropical Pacific. Specifically, we monitor the surface temperature anomaly, or the difference between the current temperature and the long-term average (currently defined as the 1991-2020 period). When we take the seasonal (three-month) average of this temperature anomaly, we call this time series the Oceanic Niño Index. For December – February 2024-25, this index was -0.6˚Celsius (1˚Fahrenheit), just slightly exceeding the La Niña threshold of -0.5˚C, unofficially making this a weak event by traditional standards. In fact, when all is said and done, we don’t expect this La Niña will be recorded as an ‘official’ La Niña in the Climate Prediction Center’s past events table, since it probably won’t last long enough to meet the length requirement, which is five consecutive three-month “seasons”.
However, La Niña’s supposedly “weak” strength only considers what has happened compared to the historical record in the east-central Pacific. It doesn’t consider what else might be going on outside of that location. As we have discussed repeatedly (like in Emily’s February post), the unusual warmth we have seen throughout the tropics outside the eastern equatorial Pacific has the potential to accentuate La Niña’s impacts. Why? The warmth throughout the tropics enhances the difference with the cooler conditions in the eastern Pacific, and that difference is what drives the changes in the tropical atmosphere and the cascade of global impacts that follows.
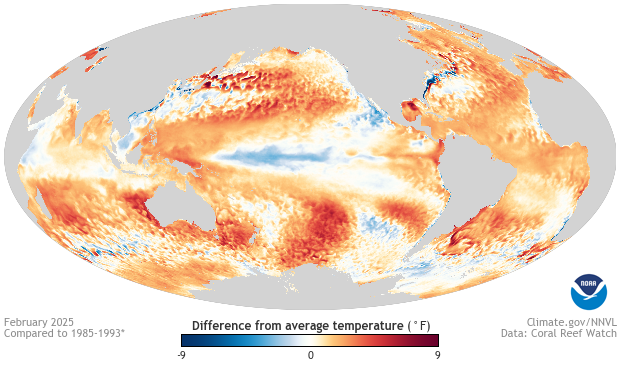
February 2025 sea surface temperature compared to the 1985-1993 average (details on climatology from Coral Reef Watch). The surface temperature of the east-central tropical Pacific is slightly below average, but much of the global ocean remains warmer than average. Therefore, the east-central tropical Pacific is much cooler relative to the rest of the tropical oceans than the blue shading alone indicates. NOAA Climate.gov image from Data Snapshots.
To account for the impact of warming or cooling outside of the east-central Pacific, climate scientists have made a small but important modification to the traditional Oceanic Niño Index: take the traditional index, subtract the average sea surface temperature of the entire tropics, and call this modified index the Relative Oceanic Niño Index (RONI) (see additional adjustment in footnote #1). So, the new index measures how warm or cool the east-central tropical Pacific is relative to the rest of the tropics.
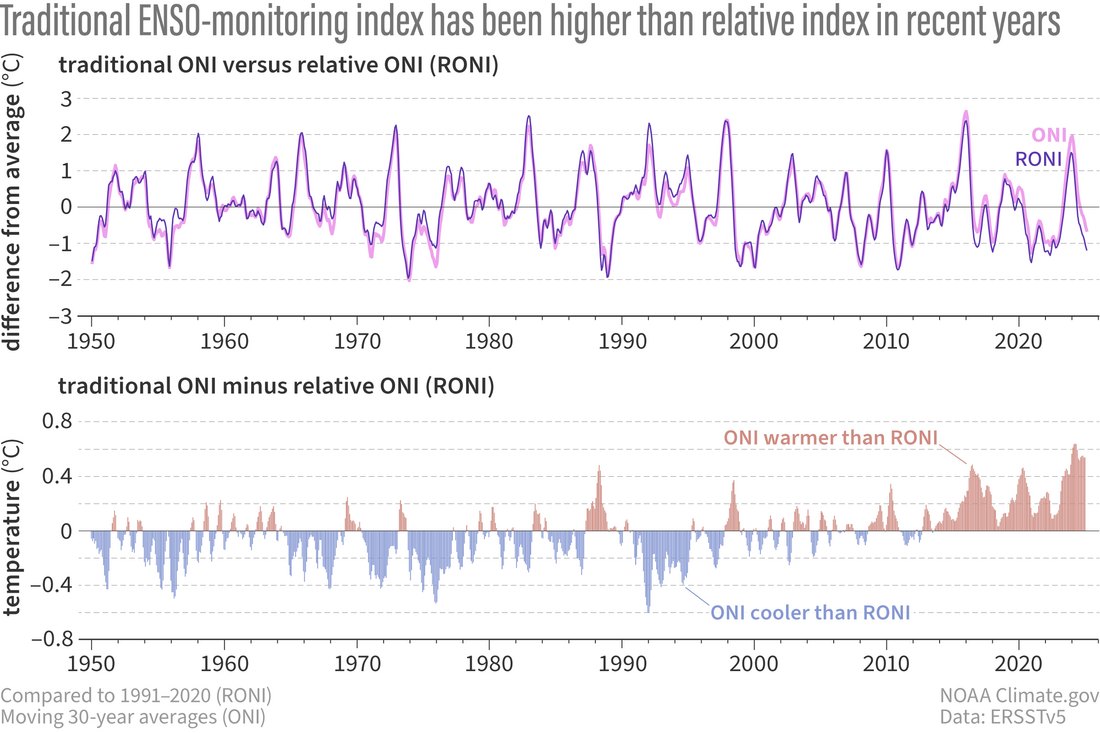
(top) Time series of the traditional Oceanic Niño Index (ONI) and the Relative Oceanic Niño Index (RONI) since 1950. (bottom) The difference between the two indexes. The growing difference between the ONI and RONI over the past few decades means that an increase in temperature in the Niño-3.4 region is more commonly accompanied by an increase in temperature in the surrounding oceans, so the relative temperature difference between the Niño-3.4 region and surrounding tropics is decreasing. Therefore, the traditional ONI has been consistently higher than the relative ONI (RONI), especially in the last few years. NOAA Climate.gov image, based on analysis by Michelle L’Heureux.
As shown in the plots above, the warming of the tropical oceans has resulted in a growing difference between the traditional index (ONI) and the newer, relative index (RONI), with the traditional index more than 0.5˚C (0.8˚F) warmer in recent seasons. In fact, the RONI value for this past winter was about 0.6˚C cooler than the traditional index: the -1.2˚C RONI this winter was the 9th lowest December-February value since 1950, putting this recent La Niña firmly in the moderate-strength category if we use this alternative index instead of the traditional one.
Game time!
The traditional ONI and the relative ONI offer two ways of ranking the strength of the ocean part of this La Niña: weak by traditional standards, moderate by relative standards. Now we are going to put these two alternative perspectives in a head-to-head precipitation matchup to see which is more consistent with this winter’s observations. In the maps below, I compare the actual winter 2024-25 precipitation pattern (right) with what we would expect based on the historical relationships with the traditional (left) and relative (middle) Oceanic Niño Indexes. The “reconstructed” precipitation patterns in the two left panels below represent what we would expect, on average and based on the historical record, when each index has the value that occurred this past winter (footnote #2).
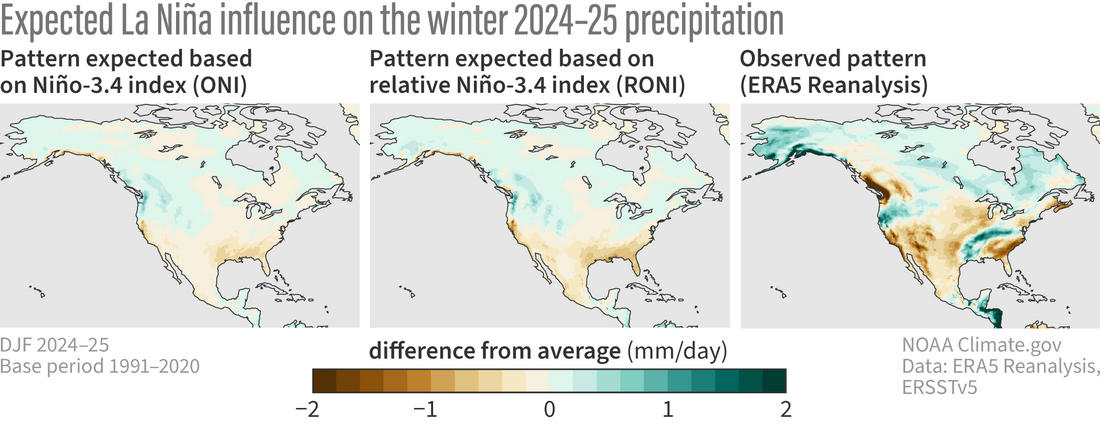
(left to right) The geographic pattern of precipitation we'd expect for this past winter (Dec-Feb 2024-25) based on the historical relationship with past observed Oceanic Niño Index (ONI) values from 1952-2025, the geographic pattern of precipitation we'd expect for this past winter based on past Relative Oceanic Niño Index (RONI) values over the same period, and the precipitation pattern that occurred this past winter from ERA5 Reanalysis,. The larger differences from average in the center plot relative to the left plot primarily reflect the lower RONI value this past winter (-1.2°C) compared with the observed ONI (-0.6°C). NOAA Climate.gov image, based on analysis by Nat Johnson.
Let’s see which perspective wins this match-up! Overall, the ONI and RONI perspectives produce similar precipitation patterns, but the stronger, more negative RONI values this winter produce a precipitation pattern that better matches the intensity of what happened this past winter (like in the dry southwestern and southeastern U.S.). We can quantify the similarity between the actual observed precipitation pattern that occurred and the two La Niña patterns with “match scores” (3) that we have used previously in the blog (like in Michelle’s recent post). These match scores range in value from -1 to 1, with a value of -1 indicating patterns that are mirror opposites (very poor match), a value of zero indicating no similarity between the two patterns, and a value of 1 indicating a perfect match. So, a match score greater than zero indicates that there is at least some similarity between the precipitation pattern this winter and the pattern expected from La Niña’s influence.
The precipitation pattern based on the traditional ONI has a modest resemblance to what actually occurred, with a match score of 0.08 for all of North America and 0.17 over the contiguous United States (25°N - 50°N). However, the match score based on the RONI perspective is higher: 0.17 for all North America and 0.30 for CONUS (footnote #4). Therefore, for this particular match-up, the argument for moderate-strength rather than weak La Niña precipitation impacts gets the win. In other words, the Northern Hemisphere atmosphere responded to this La Niña more like a moderate-strength event than a weak one, which is what the dynamical climate models from the NMME system were predicting last fall when I discussed them here.
Seasonal prediction is not a single-elimination knockout
Before you start thinking we should just go all in on the Relative ONI, I want to stress that the outcome of a single match-up for a single season is not sufficient to determine whether the new relative ONI/moderate La Niña perspective is better than the traditional ONI/weak La Niña perspective, just as a single game or match in competitive sports is rarely sufficient to determine the better team. We’re going to need to compare the two across many different situations, with many different global background conditions before we can make a call like that.
Moreover, La Niña did not have a dominant precipitation influence in everyone’s back yard this winter, and in some winters, the precipitation pattern will have no clear resemblance to the expected El Niño or La Niña influence. There are many other factors that shape our winter precipitation pattern, but, if we were to think of the winter precipitation forecast as a basketball tournament, then ENSO will usually be the top seed, and every other factor would be an underdog. College basketball fans know that the top seed doesn’t always win the tournament, but in the long run, your tournament brackets will have more success when you pick the one-seed over the lower-seeded underdogs. So, if there happens to be a winter outlook tournament pool next year, and if El Niño or La Niña returns again next winter, then I won’t hesitate to choose ENSO for my bracket.
Footnotes
-
One small detail I omitted – we also rescale the relative Oceanic Niño Index (i.e., multiply the time series by seasonally-evolving factors) so that it has the same variance as the traditional index (as described in this paper). This makes it much easier to compare the traditional and relative indexes in an apples-to-apples sort of way and to apply the relative Oceanic Niño Index to the categorization of El Niño or La Niña strength.
If you want to calculate this on your own we have some github code to compute relative ONI using observations. If you don’t want to calculate it yourself, you can also find monthly Niño-3.4 and seasonal (RONI) relative indexes on the CPC webpage.
-
As in my December post, the “expected” precipitation passed based on the Niño-3.4 index is the simple linear regression of December – February precipitation anomalies at each grid point on the Oceanic Niño Index (traditional or relative) as the predictor. In this case, however, the regression model is trained with all ERA5 December-February precipitation fields and ERSSTv5 Niño-3.4 index values from 1952-2023. Whereas my December post focused on the forecast signal from the NMME models, this post focuses on the observed relationships between the Niño-3.4 indexes and North American winter precipitation.
-
The technical name for these match scores is “pattern correlation,” specifically a “centered” pattern correlation because the area-averaged precipitation value is subtracted during the calculation. Also, for simplicity, note that I’m flipping the sign of the score compared to Michelle’s earlier post which used negative values to convey a better match to La Niña and positive values to indicate a better match to El Niño. The sign convention is arbitrary and because this post is not analyzing El Niño, I decided to change this from negative to positive.
-
The match scores were highest for the NMME forecast. The scores were 0.32 for North America and 0.35 for the CONUS region, suggesting that the NMME may have captured some modest additional sources of forecast skill beyond the La Niña influence (like trends).
Comments
Heat
Great job! Way to suss that out. I have another question for you as your post has me thinking about all the changes going on right now on the planet. Does a more acidic ocean absorb heat from sunlight quicker, slower, or the same as a less acidic ocean? Maybe there are thresholds therein.... Maybe you should cruise on out(I mean take a research expedition on out) to Fiji, parts of Hawaii, Samoa, etc and find historical ph levels versus current ph levels in the El Nino and surrounding regions. You know, for research. Feed back loops are all the rage I'm sure.
Thank you!
Thanks for your comment! I don't know the answer to your question about ocean acidity directly, but the more indirect connection may be through ocean biology. In fact, the amount of biological activity, measured by the amount of chlorophyll in the upper ocean, does affect the amount of sunlight absorbed and therefore can even impact the evolution of ENSO. Maybe we should have a post on this sometime!
La Nina Modoki
This event surely looked like a central based event. A modoki with warm El Nino type temps in the Nino 1.2 region but it appears that didn't result in any differences in California anyway
Modoki
I haven't looked closely at this, but I am not surprised that there would be little difference in impact between a canonical La Nina (centered a bit more in the eastern Pacific) and a Modoki La Nina. The reason is that the impacts of La Nina occur primarily through the changes in tropical Pacific rainfall. Normally, the eastern equatorial Pacific is dry in winter, so it has little effect on the global atmospheric circulation. If the eastern Pacific is much colder than average (canonical La Nina) or if it is near- or even slightly above average (modoki La Nina), the result is the same: the eastern equatorial Pacific remains dry. So, overall, the tropical Pacific rainfall pattern probably won't change much whether it's canonical or Modoki La Nina.
It can be a different story for El Nino, however. The eastern Pacific tends to remain dry for a Modoki El Nino, but if we have a strong, more eastern-focused El Nino, then the ocean temperature may rise high enough that the tropical rainfall actually does shift eastward, which can alter the global circulation. So, there likely is an asymmetry between flavors of El Nino versus flavors of La Nina when it comes to differences in global impacts.
La Niña Signals Fizzle by End of March 2025
Here is my take on the developing La Niña that failed to sustain. ENSO Neutral Conditions Prevails.
This ENSO status will be revisited for reclassification due to potential adjustments in sea surface temperature (SST) norms for the Niño regions, based on the 1996–2025 base period. The CPC updates this 30-year base period every five years, with the next revision scheduled for early 2026.
Comments have been disabled on this article