April 2025 ENSO update: La Niña has ended
After just a few months of La Niña conditions, the tropical Pacific is now ENSO-neutral, and forecasters expect neutral to continue through the Northern Hemisphere summer. Neutral is also the most likely state through the fall (greater than 50% chance).
What is ENSO? What does neutral even mean?
ENSO stands for “El Niño/Southern Oscillation,” a pattern of changes in the temperature of the ocean surface and atmospheric circulation of the tropical Pacific region. La Niña means the surface water is cooler than average, the trade winds are stronger, and the central equatorial Pacific receives less rain. On the other hand, El Niño is represented by warmer surface water, weaker trade winds, and more rain in the central and sometimes eastern Pacific.
Both phases of ENSO change global weather and climate patterns, including temperature and rain/snow patterns, hurricanes, tornadoes, and many other impacts. Since El Niño and La Niña can be predicted months in advance, their known changes to global climate allow us an early picture of upcoming seasonal patterns. “ENSO-neutral” means that neither El Niño nor La Niña are in effect, and global seasonal conditions are less predictable (for more on what neutral means, check out the second half of this older blog post).
A very brief La Niña
How do we know that La Niña has ended? Our primary metric for ENSO is the surface temperature of the ocean in the Niño-3.4 region of the east-central Pacific. The surface temperature in this region is compared to the long-term average, providing us with an index that measures how much the water is warmer or cooler than average. Long-term is currently 1991–2020 (more on that later!). The La Niña threshold is a Niño-3.4 index of at least -0.5 °C (-0.9 °F). With the March 2025 Niño-3.4 index measuring -0.01 °C (i.e., nearly identical to the 1991-2020 average) according to our most reliable sea surface temperature dataset (ERSSTv5), we can say with confidence that La Niña conditions have ended.
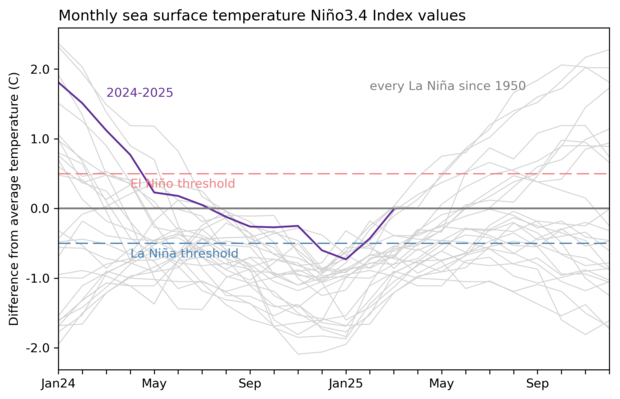
2-year history of sea surface temperatures in the Niño-3.4 region of the tropical Pacific for all La Nina events since 1950 (gray lines) and the recent (2024-25) event (purple line). After dipping into La Niña for a few months, the Niño-3.4 index returned to near average in March 2025. Graph by Emily Becker, based on monthly Niño-3.4 index data from CPC using ERSSTv5.
Last month, forecasters expected neutral conditions would develop very soon, and indeed they did. The combination of below-average temperatures weakening in the central Pacific and the westward expansion of very warm water in the far eastern Pacific helped to dissipate the cooler surface of La Niña.
This animation shows weekly sea surface temperatures in the Pacific Ocean compared to average for late January through early April 2025. Orange and red areas were warmer than average; blue areas were cooler than average. La Niña's cooler-than-average sea surface temperatures in the key ENSO-monitoring region of the tropical Pacific (outlined with black box) have dissipated in recent weeks. NOAA Climate.gov animation, based on Coral Reef Watch Data and maps from NOAA View.
Over the past few months, there has been a substantial amount of cooler-than-average water under the surface of the equatorial Pacific, but this has also waned in recent weeks. The subsurface provides a source of fuel to the surface, so the marked decrease in cooler subsurface water is another indication that La Niña has ended.
ENSO is a coupled ocean-atmosphere system, meaning characteristic changes are required in both the ocean and the overlying atmospheric circulation to qualify as La Niña or El Niño. During La Niña, the Walker circulation—the overturning loop in the atmosphere over the tropical Pacific—gets amped up, signified by the stronger trade winds, more storms over Indonesia, and a less rainy central Pacific region. These atmospheric signs of La Niña were still around in March, but without the ocean surface temperature component, the overall system qualifies as ENSO-neutral.
A matter of time
As mentioned above, our definition of “long-term” is currently the 1991–2020 average. The use of a 30-year average for seasonal climate prediction is the World Meteorological Organization standard. For most prediction purposes, the average period is updated every 10 years, but for ENSO prediction, we update it every 5 years, to try to account for changes in the tropical Pacific Ocean.
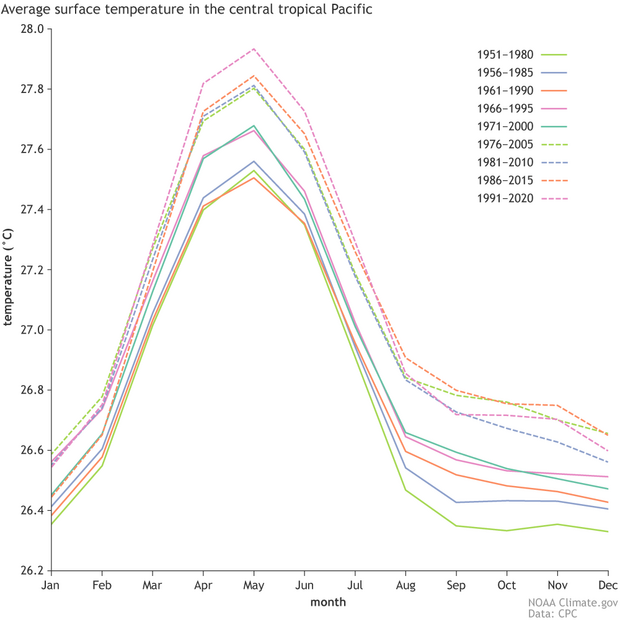
Thirty-year average periods that NOAA is using to calculate the strength of historic El Niño and La Niña events. Climate.gov figure from ERSSTv5 data, based on CPC original.
In addition, the historical ENSO table uses a centered averaging period, e.g., the individual years in 1986–1990 are compared to the 30-year average 1971–2000, and the years in 1991–1995 are compared to 1976–2005. Check out CPC’s webpage on the “rolling” climatology approach.
The reason for mentioning this detail is that this past winter does not qualify as a La Niña event in our historical table, because it did not last 5 consecutive rolling seasons (we call any 3-month-average a season) exceeding the -0.5 °C threshold. However, in 2036, this past winter will be near the middle of a 30-year period (2006–2035), which is very likely to be warmer than the 1991–2020 average. Thus, with the benefit of another decade, this year’s small La Niña may be cooler when compared to that warmer averaging period. So, in 2036, the 2024–25 winter may end up colored blue, and be considered a formal La Niña, in the historical table.
This complexity is one of the reasons we have been mentioning relative sea surface temperature anomalies, which are the sea surface temperature differences from average in a particular location, like the Niño-3.4 region, relative to the entire tropical average sea surface temperature. By using relative sea surface temperature measures, we can skip calculating all of these rolling climatologies. For the relative index, we only need to use a single climatology over the entire historical record. As we have mentioned in recent blog posts (here and here and here), the relative Niño-3.4 index has also been better than the more traditional indexes at describing the intensity of the expected atmospheric response to ENSO during this past La Niña.
The outlook for the rest of 2025
ENSO-neutral is likely through the summer. Chances for El Niño or La Niña increase later in the year, with La Niña chances about double those of El Niño, but neutral is still the highest probability through the early winter.
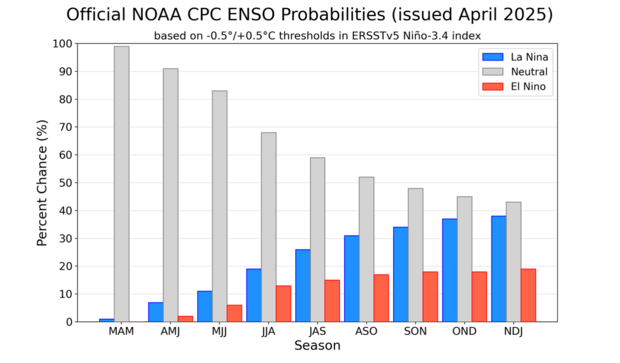
Out of the three climate possibilities—La Niña, El Niño, and neutral—forecasts say that ENSO-neutral conditions (gray bars) are most likely for the Northern Hemisphere spring and summer. Looking out to the fall, neutral is still the most likely, but chances for either La Niña (blue bars) or El Niño (red bars) are increasing. NOAA Climate Prediction Center image.
This outlook is largely based on computer climate model forecasts. The consensus of the North American Multi-Model Ensemble, a collection of climate models, also predicts neutral, but there is a substantial range of potential outcomes for later in the year.
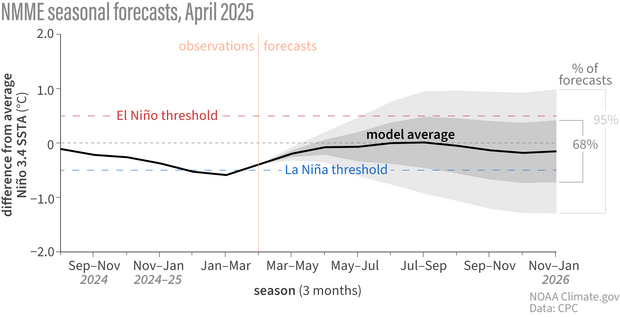
Line graph showing observed and predicted temperatures (black line) in the key ENSO-monitoring region of the tropical Pacific from spring 2025 through the fall. The gray shading shows the range of temperatures predicted by individual models that are part of the North American Multi Model Ensemble (NMME, for short). By late summer, the shading spans from El Niño to La Niña, showing the range of potential ENSO states. However, the majority of model forecasts are concentrated in the neutral range, meaning the highest chance is that the temperature in the Niño-3.4 region of the tropical Pacific will be near average. NOAA Climate.gov image, based on data provided by Climate Prediction Center.
Forecasts made in the spring are known to be less successful than forecasts made in the rest of the year, an effect called the “spring predictability barrier.” We don’t have a clear understanding of why forecasts are worse this time of year, but one potential culprit is that ENSO tends to be changing phase (e.g., going from La Niña to neutral). For lots more detail on the spring predictability barrier, check out this post and this one on Seasoned Chaos on the topic.
As spring turns to summer, our crystal ball should become clearer. For now, we’ll bid La Niña adieu and bide our time in neutral.
Comments
ENSO neutral
Seems the models that were forecasting La Nina earlier in the year have been trending toward ENSO Neutral. Those of us in the Southwest part of the United States are fine with that outcome to happen over La Nina
El Niño in 2025-26? Another Wet Winter in SoCal 2025-26?
It seems like due to the Weak and Short Lived La Niña this year, it seems like the La Niña effects may be short lived. Could SoCal see a wet winter in 2025-26 even in ENSO Neutral (SoCal had a wet winter in 1985-86 ENSO Neutral that followed a couple Weak La Niñas in 1983-85 after a Strong 1982-83 El Niño due to Weak La Niñas making La Niña effects short lived)? Also could an El Niño show up unexpectedly in 2025-26 following the 2024-25 Weak and Short Lived Single Dip La Niña and not be realized until Mid-Late Summer even though odds are not in favor of El Niño according to NOAA (I thought 2006-07 was an example of something like this occurring following the 2005-06 Weak and Short Lived Single Dip La Niña)? If it does, even a Weak El Niño could add fuel to a wet winter in SoCal in 2025-26 following a dry winter in SoCal 2024-25 (a wet winter in SoCal 2025-26 could avert the drought from 2024-25 dry winter from being an emergency) given how recent the last Strong El Niño wet winter in SoCal was in 2023-24 (also similar to how 2002-03 Moderate El Niño wet SoCal winter was followed by 2003-04 ENSO Neutral dry SoCal winter and then followed by 2004-05 Weak El Niño wet SoCal winter where the wet winter in 2004-05 in SoCal averted drought from 2003-04 dry winter being an emergency).
model analysis for a year
I am interested in the forecast models for 2025-2026 in eastern Virginia in a year
Here is the CPC seasonal…
Here is the CPC seasonal outlook for temperature and precipitation (click the "0.5 Month Outlook" etc links). This product updates once a month on the 3rd Thursday of every month. Enjoy!
Here is the CPC seasonal…
Here is the CPC seasonal outlook for temperature and precipitation (click the "0.5 Month Outlook" etc links). This product updates once a month on the 3rd Thursday of every month. Enjoy!
El Nino 25/26
If you look at the odds posted here and at IRI/CPC there is not likely to be an El Nino next winter
year
Could SoCal see a wet winter 1996-1997 even in ENSO Neutral for 2025-26
Dry El Nino will be at end of (2006-07) for 2026-27
so el Nino multi-year
We get Multi-year El Niño winter in SoCal was in 2026-27(also similar to how 1986-87 Moderate El Niño dry SoCal winter was followed by 2027-28 Strong El Nino was below average precipitation, drier in 1987-88, for 12.48" Inches!
there is still some…
there is still some atmospheric response of la nina.Andd many models think it will linger,so it is early to say it
La Nina
Without neutral SSTs in the Nino region La Nina has lost its fuel and it won't be long before the atmosphere decouples
We will see! The relative…
We will see! The relative SST index still remains about ~0.5C cooler and I still see hints of enhanced trade winds around the Date Line, suppressed rainfall over the Date Line, and enhanced rainfall over the Maritime Continent. So, while the traditional SST anomalies are now Neutral, there are still a lot of La Nina-like features in the tropical Pacific atmosphere...
La Nina
When do you think the IRI/CPC will have their ENSO update? Usually they update their plots around the 19th of the month
Will take a weak signal El…
Will take a weak signal El Nino as best chance for decent winter moisture in southwest but doubt it will occur if trend is looking at neutral to weak La Nina reapearing! I remember 2010/2011 winter being a dry period, kind of, it was strong enough La Nina that some good rain occured in last weeks of December several weeks in a row. 2015/2016 was a very very strong El Nino and it meant a very dry southwest winter, not as dry as this year’s weak La Nina but very dry!
DRY!
Another weak La Nina 2025/2026 will spell disaster for southwest! Weak signal La Nina seem to be the driest for Southwest US winters, strong El Nino similarly also make very dry winter in spite of being El Nino. If there’s a weak La Nina or strong El Nino then more drought likely the outcome for CA/AZ/western NM for 2026! Hope for a neutral winter as best bet to maybe get some rain even if still less then average, hoping its moremthen this past season! Can’t rely on monsoon anymore, only CA and far western AZ, or far eastern NM can count on monsoon flow, rest of the zone tends to have dud monsoons because monsoon high no longer migrates to Oklahoma in summer, rather stays locked up over Utah majority of summer and early fall.
!
La Nina Global Precip
The La Nina is certainly weakening in terms of SST, but is still hanging on in terms of very large-scale rainfall patterns--see https://essic.umd.edu/global-precipitation-summary-for-march-2025/
precip pattern
That certainly looks to be true! That's a good link.
Not a historic La Niña
Per https://origin.cpc.ncep.noaa.gov/products/analysis_monitoring/ensostuff… it does not look like this year qualifies as a "historic" La NIña as there were not 5 consecutive overlapping seasons.
historical La Nina
This is true. However, as discussed in the post, this table will be revised as the ONI climatology gets updated every 5 years until 2025 is near the center of the 30-year climatological baseline. To quote Emily from this post:
"The reason for mentioning this detail is that this past winter does not qualify as a La Niña event in our historical table, because it did not last 5 consecutive rolling seasons (we call any 3-month-average a season) exceeding the -0.5 °C threshold. However, in 2036, this past winter will be near the middle of a 30-year period (2006–2035), which is very likely to be warmer than the 1991–2020 average. Thus, with the benefit of another decade, this year’s small La Niña may be cooler when compared to that warmer averaging period. So, in 2036, the 2024–25 winter may end up colored blue, and be considered a formal La Niña, in the historical table."
So, there's still hope that this will be a historical La Nina within the table eventually!
2025 Hurricane Season Impacts
How will this neutral phase effect this years Hurricane Season in the Gulf and Atlantic.
Thank you
The NOAA seasonal outlook…
The NOAA seasonal outlook for tropical storms will be issued on May 22nd so stay tuned!
IRI/CPC April Update
The mid April IRICPC update out today. Seems the odds continue to increase for ENSO neutral and lessen for La Nina. I dont think there is a model left that is still forecasting a La Nina next fall
IRI plume
It looks like there are a few models, mostly statistical models, predicting a second-year La Nina, but you're right that this is about as neutral-looking a plume as we can expect to see. I will note, however, that the ENSO neutral probabilities dip below 50% by SON, so even though ENSO neutral is favored, it's far from a sure thing this far in advance.
ENSO
Thanks Nathaniel,
Just seems the way things are trending we will have an ENSO Neutral year this coming winter. My very unscientific view, lol
spring
During this time of year (spring predictability barrier), unscientific opinions have nearly as much value as the scientific ones. :-)
Thanks Emily Becker. The end…
Thanks Emily Becker. The end of La Niña confirms a climatically neutral phase with no surprises expected. It would be wise to monitor developments in the Pacific Ocean over the summer in preparation for possible changes in the second half of the year.
Thank you for the article…
Thank you for the article.
Neutral winter
Could neutral winter 2025-2026 mean more snow and cold for Wisconsin I hope so. La Niña fail to bring me snow and cold why everyone gotta complain about La Niña El Niño is worse than La Niña I say La Niña is coming back u can’t said no La Niña it’s early tho.
cold and snow for Wisconsin
It's certainly possible that Wisconsin can see more snow and cold if next winter is ENSO-neutral (or even if we have El Nino or La Nina). There are other important large-scale climate patterns that affect the winter temperature and precipitation patterns of Wisconsin, but they are much harder to predict than ENSO this far in advance.
Thanks so much
Thanks so much for answering me I hope we have enso neutral next winter I think La Niña is not best for snow and cold it was a much warmer winter this past winter. I think neutral is better for snow than La Niña and El Niño
La Niña May 2025
La Niña May/2025
Hello I’m Rebaz Abdul teacher geography and weather I will refer to the weather of May in detail:-
The weather in May is very dangerous because the La Niña phenomenon has an activity rate of 40% and activity El Niño phenomenon has an activity rate of 0% and temperature of 40 to 45 degrees, with makes our weather more difficult.
Teacher Rebaz Abdul geography and weather.
Neutral Phase in Germany/historical side
For my new Climate Novel I read a lot about La Nina, El Nino and the neutral phase, including the FAO-Study about 30 years. I was quit surprised that the heavy rain/downpours over the "Ahrtal" or near by "Erftstadt" were in beginning summer during a neutral phase. On wikipedia or old books you could research the time-shedule comparint it with your historical grafic I read before. What do you think about it? Best from Cologne.
So many la ninas
Why so many la Nina’s since 2020? Every La Niña is a double or triple dipper but then we get on El Niño year and right back to La Niña. Historic drought in Kansas coming from this
It does seem like there have…
It does seem like there have been a lot of them, but I don't think we can confirm the causes of them. You might also be interested in this post which points out the trend across the tropical Pacific has been La Nina-like for the last several decades: https://www.climate.gov/news-features/blogs/enso/how-pattern-trends-across-tropical-pacific-ocean-critical-understanding
Comments have been disabled on this article