How do weather observations become climate information?
Early Weather Records
Some explorers and pioneers described daily weather in handwritten journals and logbooks. These served as a record of weather in one place, but they were only rarely gathered or compared to understand regional conditions.
In the early 1800s, an Army physician who wanted to understand how weather affected the health of the troops initiated a systematic effort to collect weather data. He had soldiers at army posts across the country observe and record their daily weather and send their records to a central location. This effort eventually resulted in more than twenty years of weather records for a large part of the United States. In 1891, the task of monitoring weather was transferred from the military to a civilian corps, creating the agency we now call the National Weather Service (NWS).
As reliable, affordable weather instruments and methods for recording and storing data improved, people began to collect and share their weather records. Scientific organizations established standard instruments and procedures for weather-observing stations and develop systems to collect the information.

One example of weather data collected at Old Faithful in Yellowstone National Park in Wyoming. Click the image for a larger view.
Quality controls on weather data
Observers and automated stations record and submit raw data to NOAA’s National Center for Environmental Information (NCEI) on a daily or monthly schedule. Meteorologists at NCEI use computers to perform a basic check of all incoming data. Computer programs check the patterns in each data record for any signs of malfunctioning equipment or systemic errors such as those shown below.

The top left graph shows a common pattern of mid-morning temperatures measured every 5 minutes. The remaining panels show data patterns that may indicate a disturbance or a problem with the instruments. Data records that show these types of artifacts are flagged and excluded from further processing when calculating climate.
Weather data are also checked for consistency across a region. Scientists check data sets from comparable stations to see if the data makes sense for the region and time of year. For example: does one station report sunshine and warm temperatures while a neighboring station shows sub-zero temperatures and clouds? If they find inconsistencies, meteorologists methodically track down the source of the inconsistent data. At this point, original data values may be flagged as incorrect, and excluded from further processing, but they are never changed or edited, unless the error was due to incorrect transcriptions by volunteers.
Once weather data has passed quality control, it becomes part of the larger data record. The data can then be processed to generate climate products such as maps and graphs.
Long-term records of short-term data
Over time, records of weather observations help us understand the long-term conditions at each location.

Animation showing maximum daily temperature ("afternoon highs") at Washington National Airport for 1 year, 3 years, and 30 years. In the frame showing 30 years of data, the scattering of individual dots (weather) becomes a broad swath that marks the long-term range of maximum temperatures (climate). Animation by NOAA Climate.gov. Download individual graphs (zip folder).
Climate scientists quantify long-term average conditions for each date of the year by calculating the average (mean) of observed temperature, precipitation, humidity, and others. At the beginning of every new decade, NOAA scientists calculate official Climate Normals for the previous three decades. These average values are the “normal” against which we compare our daily weather. Climate Normals help us answer the question: “How does today's weather compare to average conditions over the previous three decades?”
From Raw Data to Informative Products
The most common processing steps used to turn daily weather data into climate data products involve straightforward mathematics. Operations such as adding and averaging turn weather data into climate information. For instance, a station's daily average (mean) temperature is calculated by averaging the minimum and maximum temperatures for the day: daily average = (minimum + maximum) / 2. As another example, a station's average monthly maximum temperature is calculated by averaging all the daily maximum temperatures observed during the month. For precipitation data, the most common processing step is adding: for instance, monthly precipitation values are calculated by adding the depths of precipitation from each day over the entire month.
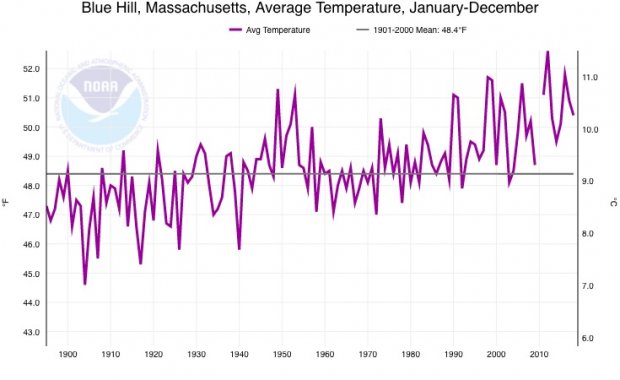
The purple line connects annual average temperatures observed at Blue Hill, Massachusetts from 1885 to 2018. Each annual average was calculated from a full year of daily averages of minimum and maximum temperatures. For comparison, the horizontal black line shows the overall average temperature at the station from 1901 to 2000. Image source: Climate at a Glance, NOAA.
To understand climate on larger scales, climatologists average data from individual stations with data from other stations in the area. When combining observations, the values for each station are mathematically weighted to account for the fraction of the averaging area they represent. This keeps areas with many weather stations from being overrepresented compared to areas with fewer stations.
Climate products produced from databases of observations include reports, maps, and graphics such as monthly State of the Climate reports. These data also serve as input for computer models to help generate future climate outlooks and weather forecasts.
Data for Decisions
Current weather and climate data are used in many ways. People who make decisions for cities and towns rely on accurate and easy-to-understand graphs and maps to assist them in planning for energy needs, water management, and extreme weather events. Local climate data are also used to determine city budgets for maintaining roads, bridges, and other infrastructure.
Climate data are used by people across many sectors of our economy. For example, farmers use climate data to select which crops to grow, while water managers use climate data to know when to release water from reservoirs. Read more about how climate data are used in various sectors.
Following consistent procedures at every step—from making weather observations to publishing climate products—ensures that NOAA’s climate information is accurate and reliable.