Visualizing Climate Data
You can use a number of software packages and Web sites to to access or generate image maps or graphs of historical climate data or future climate projections. The following tools are listed from easiest to most difficult:
Data Snapshots - Reusable Climate Maps
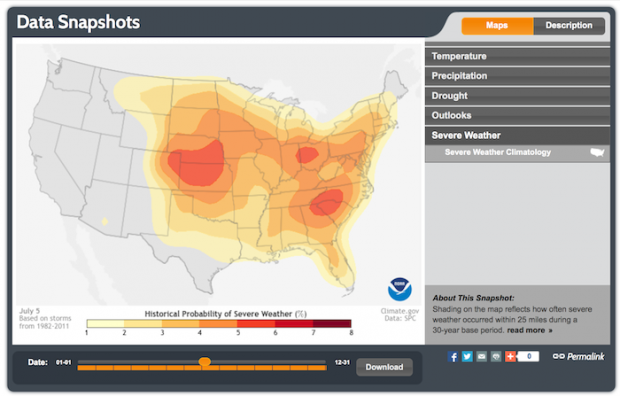
- Simple access to a collection of prepared image maps
- Difficulty rating: Easy
- Go to Climate.gov's Data Snapshots
Data Snapshots offers a range of easy-to-understand climate maps with plain English descriptions. Each set of snapshots is a simplified version of official climate products available across a number of different Websites. Time sliders let you display snapshots for various dates or watch change over time. Every image is freely available in five different sizes for download and reuse.
NOAA View Data Exploration Tool
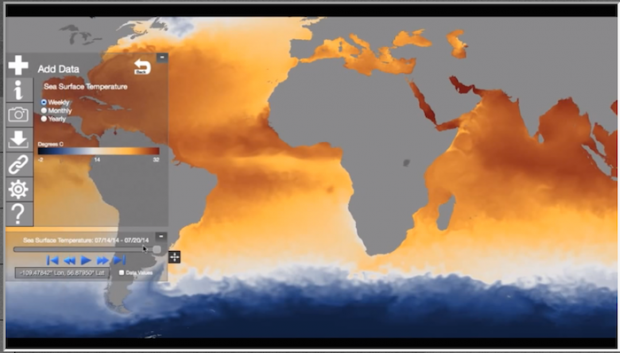
- Image map viewer with more than 60 global datasets
- Difficulty rating: Easy
- Launch the NOAA View website »
NOAA View is an introductory data viewer suitable for a broad range of audiences. It is compatible with all major browsers and many mobile devices. The tool's online interface makes it easy to explore time-series image maps of global data. Most of the 60+ datasets show data collected by instruments on satellites. Example datasets: wind speed, coral bleaching, ice cover, vegetation, precipitation, and views of Earth at night. Each dataset has a link to a description section. When viewing an image map in NOAA View, you can hover your cursor over different portions of the map to see approximate data values. You can also display specific dates, animate time series, and download .png images or KMZ (Google Earth) files.
Climate Explorer
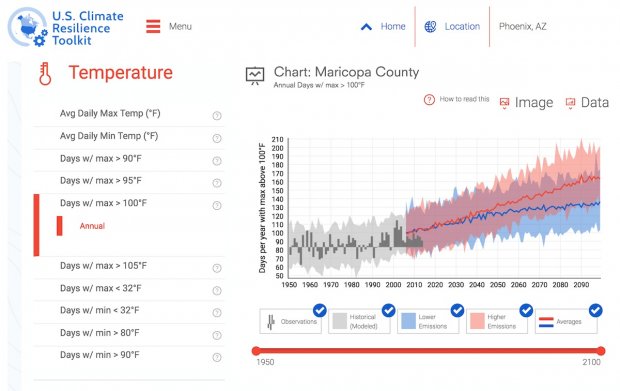
- Graphs and maps of historical observations and projections for every county in the contiguous United States
- Difficulty rating: Easy
- About Climate Explorer »
- Launch Climate Explorer »
Climate Explorer displays charts and maps of future climate projections for every county in the contiguous United States. Users can explore past conditions and those projected decades the future. Coastal residents can check how many days per year various locations have experienced high-tide flooding, and how many days they are projected to experience such flooding in the future.
Panopoly
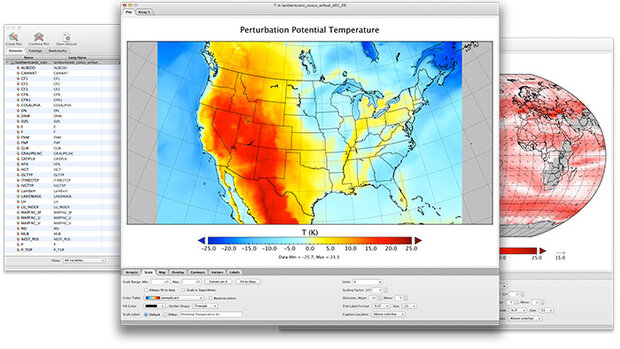
- Downloadable visualization and analysis tool
- Difficulty rating: Intermediate to Advanced
- Learn more or download Panopoly »
Panopoly is a data viewer designed to work with netCDF, HDF, GRIB and other datasets. It requires that your computer have a Java SE 7 or 8 runtime environment, or better, installed. Panopoly is best suited for intermediate to advanced data users.
In Panopoly 4 you can:
- Overlay continent outlines or masks on lon-lat map plots.
- Use any of numerous color tables for the scale colorbar, or apply your own custom ACT, CPT, or RGB color table.
- Save plots to disk GIF, JPEG, PNG or TIFF bitmap images or as PDF or PostScript graphics files.
- Export lon-lat map plots in KMZ format.
- Export animations as AVI or MOV video or as a collection of invididual frame images.
- Explore remote THREDDS and OpenDAP catalogs and open datasets served from them.
Weather and Climate Toolkit
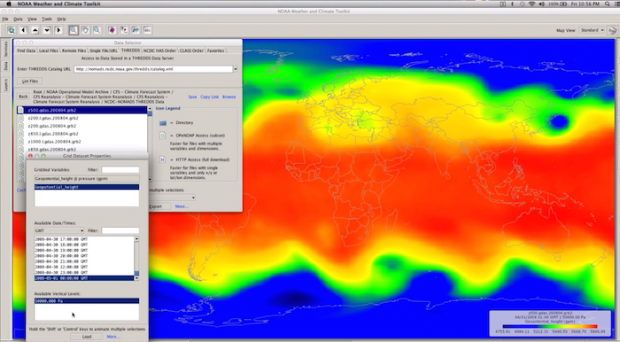
- Downloadable or online visualization and analysis tool
- Difficulty rating: Advanced
- Learn more, and/or download or launch the Weather and Climate Toolkit »
- Learn more about the tool from a short article and video »
NOAA's Weather and Climate Toolkit (WCT) is free, platform independent software. The WCT allows the visualization and data export of weather and climate data, including Radar, Satellite and Model data. The WCT also provides access to weather/climate web services provided by NCDC and other organizations. The Weather and Climate Toolkit is best suited for advanced data users. The WCT provides tools for background maps, animations and basic filtering. Users can export images and movies in multiple formats. Data can be exported from the WCT to a variety of common formats including KMZ, Shapefile, Well-Known Text, GeoTIFF, ESRI Grid and Gridded NetCDF. Advanced data export support for Google Earth enables the 2-D and 3-D export of rendered data and isosurfaces.