What environmental data are relevant to the study of infectious diseases like COVID-19?

Colorized scanning electron micrograph of an apoptotic cell (blue) heavily infected with SARS-COV-2 virus particles (yellow), isolated from a patient sample. Image captured and color-enhanced at the NIAID Integrated Research Facility (IRF) in Fort Detrick, Maryland.
The COVID-19 pandemic has triggered an increase in infectious disease modeling studies, some of which incorporate environmental parameters. These studies are driven by questions about the potential seasonality of disease transmission, potential comorbidities associated with other environmentally-linked respiratory diseases, and a desire to improve predictions to inform future national and local policies to control transmission. This page has been developed to facilitate access to environmental data commonly used in infectious disease modeling. Email questions or feedback about this page to one.health@noaa.gov.
Environmental datasets for infectious disease modeling
The table below was designed to help users quickly locate environmental datasets for a given variable and timescale. Within each cell, one or more datasets are referenced along with key information, a link to download the data, and a link to read the metadata for the source. Additional information on the data types is available below this table.
Parameter |
Observational Climate Record and Reanalyses |
Short-term Forecasts and Predictions (deterministic and probabilistic) |
Long-term Projections (scenario-based) |
|---|---|---|---|
Temperature
|
Global Station DailyGlobal Historical Climatology Network Daily - GHCN Data Access U.S. Gridded MonthlyGridded 5km GHCN-Daily Dataset (U.S. only) nClimGrid (aggregated to monthly values) Global Gridded MonthlyNOAAGlobalTemp (V5) Global Comprehensive (Reanalysis) HourlyHistorical Climate Forecast System (CFS) Time Series) Operational Climate Forecast System (CFS) Time Series Global Gridded Reanalysis HourlyNASA Modern-Era Retrospective analysis for Research and Applications (MERRA-2) Global Station Sub-DailyIntegrated Surface Database European Global Comprehensive (Reanalysis) HourlyECMWF ERA5 climate reanalysis |
NOAA NDFD ForecastLead 1-3 days Lead 4-7 days Multi-Model EnsembleNOAA National Blend of Models Monthly & SeasonalNorth American Multi-Model Ensemble Spatial: global, varies |
CMIP6 Climate ProjectionsCMIP6-GFDL Data Search | CMIP6-GFDL | ESGF-CoG Spatial: global, varied resolution |
Humidity
|
European Global Comprehensive (Reanalysis) HourlyECMWF ERA5 climate reanalysis Global Station Sub-DailyIntegrated Surface Database |
NOAA NDFD ForecastLead 1-3 days Lead 4-7 days |
CMIP6 Climate ProjectionsCMIP6-GFDL Data Search | CMIP6-GFDL | ESGF-CoG Spatial: global, varied resolution |
Ultraviolet Index Wm-2 |
European Global Comprehensive (Reanalysis) HourlyECMWF ERA5 climate reanalysis County-LevelCDC National Environmental Public Health Tracking Network Global Station Sub-DailyIntegrated Surface Database |
NOAA ForecastNWS Global UV Index Forecast |
CMIP6 Climate ProjectionsCMIP6-GFDL Data Search | CMIP6-GFDL | ESGF-CoG |
Understanding Data Sources
Station Data
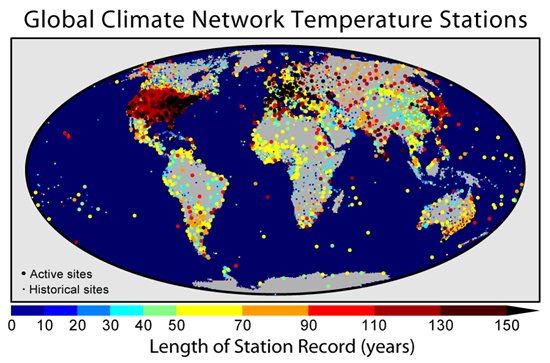
Real-time and historical data are available for surface-based weather stations on every continent. The most commonly measured climate variables are temperature and precipitation, the latter being available for more than 100,000 locations worldwide. Some stations (such as those at airports) also observe additional variables—including pressure, wind, and cloud cover—on an hourly basis. Coverage of the stations is sparse in some regions; however, most airports have a station.
Interpolated Gridded Data
Many modeling applications require data in locations that do not have weather stations. Gridded datasets bridge this gap. These datasets consist of estimated data at evenly spaced intervals, such as every 5 kilometers. Researchers construct these datasets by using station data in combination with statistical methods (e.g., by interpolating station data to a uniform grid or fitting a statistical surface through the original observations). Gridded datasets are valuable in many modeling applications that require evenly spaced data as input. They are also useful in computing averages for societally relevant areas, such as counties and census tracts. Interpolated grids estimate unknown values at locations by using nearby points where values are known. Read more about interpolation
Comprehensive Climate Monitoring Data
Comprehensive Climate Monitoring data, also known as Reanalysis datasets, are produced by running climate models over a historical period while constraining many of the values of the model to match observed values. These data are multivariate, spatially and temporally complete, and gridded. This process provides a consistent high-resolution output that smooths over data gaps by providing the best possible estimate of the true values by using both observations and models to estimate what value most likely would have been observed. For example, in a reanalysis for the period from 1950 to 2000, if a station was only active from 1970 onward, the 20 years of missing values can be estimated by constraining the model using existing observations that were active so that the temperature (and other values) that might have been observed at that station can be filled in. Read more about reanalyses »
Climate Model Output
Climate models break the globe into a 3-dimensional grid and simulate a large number of variables in each grid cell at each time step using fundamental physics equations. Climate models are “spun up” by initializing them with observations and letting them run over many years of timesteps, solving the equations for each grid cell during each step, and allowing for interactions between adjacent grid cells. Climate model output should be used to estimate longer-term, probabilistic climate statistics rather than to predict deterministic values. Read more about climate models »
Multi-Model Ensemble
A Multi-Model Ensemble (MME) is a product containing outputs from one or more models from different modeling centers that have been averaged together to create what is called an ensemble. In some cases, more than one model run (realization) per model is included, and each realization is run with slightly perturbed parameters to better represent uncertainty in the MME mean. MMEs are often more skillful than individual models, and better represent prediction error, because the ensemble as a whole balances out individual model biases to some extent. Read more about Multi-Model Ensembles »
Understanding File Formats |
Language Specific Sources |
|---|---|
|
R
Python
|
Glossary of Terms & Acronyms
- CDC = Centers for Disease Control
- CFS = Climate Forecast System
- CMIP6 = Coupled Model Intercomparison Project, version 6
- CoG = University of Colorado collaboration environment in support of the ESGF
- ECMWF = European Centre for Medium-range Weather Forecasts
- ERA5 = ECMWF Reanalysis of the Atmosphere, 5th generation
- ESGF = Earth System Grid Federation
- GFDL = NOAA’s Geophysical Fluid Dynamics Laboratory
- GHCN = Global Historical Climatology Network
- GIS = Geographical Information System
- HTTPS = HyperText Transfer Protocol Secure
- MERRA = Modern-Era Retrospective analysis for Research and Applications
- NDFD = NOAA’s National Digital Forecast Database
- NMME = North American Multi-Model Ensemble
- NWS = National Weather Service
- RH = Relative Humidity
- UV = Ultraviolet
- Wm2 = Watts per square meter
Acknowledgments
This page is developed through NOAA’s One Health Team to serve the COVID-19 and broader health research and decision making community. Acknowledgment and thanks go to: Hunter Jones, Mary Lindsey, Richard Glupker, Stan Benjamin, Georg Grell, and Juli Trtanj, NOAA Research (OAR), and Jennifer Runkle, Russell Vose, and Jeff Privette, National Environmental Satellite and Data Information Service (NESDIS).
Example Model Studies
This list of studies is compiled by the NOAA Central Library. This list is a sampling of COVID-19 studies employing climate variables and will be updated periodically. The presence of a study in this list does not imply endorsement. Many of the listed studies have not been peer reviewed.