February 2025 La Niña update: La Niña today, gone tomorrow?
La Niña conditions continue, but forecasters estimate a 66% chance of a switch to neutral in March–May. This is looking like a weak and short La Niña. Also, while La Niña’s ocean conditions are currently weak, the atmospheric component is fairly strong. Today, I’ll cover current conditions, the forecast, and that mismatch between the ocean and atmosphere across the tropical Pacific Ocean.
Live in the moment
La Niña and its counterpart El Niño make up the El Niño/Southern Oscillation, or ENSO. La Niña’s characteristic cooler-than-average tropical Pacific surface water changes global atmospheric circulation in known ways, providing an early picture into potential upcoming temperature, rain/snow, and other climate patterns. El Niño’s warmer-than-average tropical Pacific also has global impacts on climate patterns. In between the two phases, when the tropical Pacific is near average temperature, lies neutral conditions. ENSO is predictable months in advance, giving us a heads-up on hurricane and tornado seasons, coastal flooding, atmospheric rivers, drought, next summer’s temperature, global crop yields and disease outbreaks, and even financial markets.
Yesterday, today, tomorrow
Our primary index for La Niña and El Niño is the surface temperature of the east-central tropical Pacific Ocean in the Niño-3.4 region—specifically, how much that temperature differs from the long-term average, where long-term is currently 1991–2020. In January, the Niño-3.4 index was -0.8 °C, according to our most reliable dataset, the ERSSTv5. This is the second month in a row that the Niño-3.4 index has exceeded the La Niña threshold of -0.5 °C, and falls into our unofficial “weak” category: a Niño-3.4 index between -0.5 and -0.9 °C.
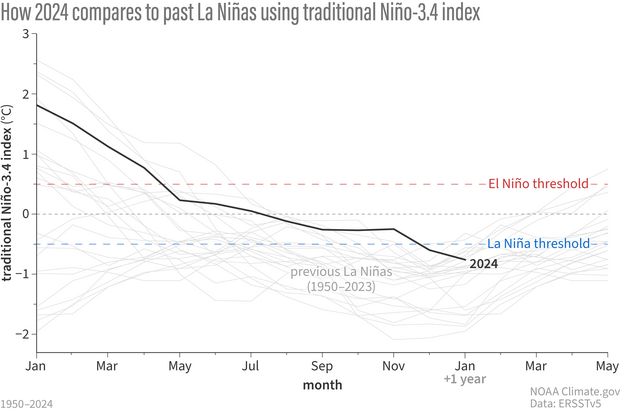
How sea surface temperatures in the Niño-3.4 region of the tropical Pacific changed over the course of all La Niña events since 1950 (gray lines) and 2024-25 (black line). This shows the traditional calculation for Niño-3.4, the monthly temperature compared to the most recent 30-year average (1991–2020 for the 2024 line). By this measure, the La Niña threshold was crossed in December 2024, but La Niña remains weak. Climate.gov graph, based on data from Michelle L’Heureux from CPC using ERSSTv5.
The atmospheric component of La Niña includes stronger near-surface trade winds, stronger upper-level winds, more rain than average over Indonesia, and less rain over the cooler waters of the central tropical Pacific. All these signs were observed during January, evidence of La Niña’s expected strengthening of the Walker circulation, and we can say with confidence that La Niña conditions are present. There’s more to this atmospheric story, but you’re going to have to wait a few paragraphs!
Most of our computer climate models predict that the sea surface temperature will stay in La Niña territory for just a few more months. These predictions are the primary factor behind the 66% chance that the March–May period will reflect ENSO-neutral. In fact, there’s a 41% chance La Niña conditions will end even earlier, in the February–April season, although the strongest odds are for continued weak La Niña during that period.
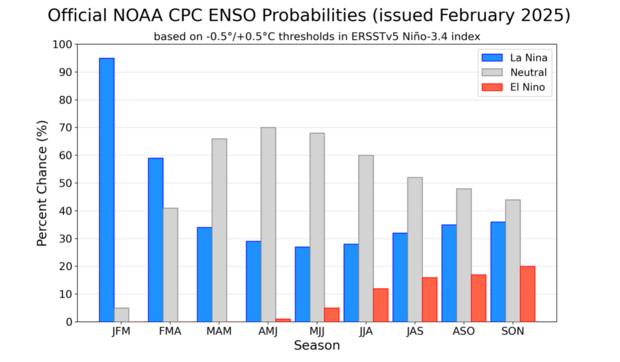
Out of the three climate possibilities—La Niña, El Niño, and neutral—forecasts say that ENSO-neutral conditions are most likely for the March–May period (gray bar). Looking out to the Northern Hemisphere fall, neutral is the most likely, but La Niña (blue bar) has nearly twice the odds of El Niño (red bar). NOAA Climate Prediction Center image.
Looking further ahead, there are no strong signals right now for next fall and ENSO-neutral is favored, but we do see a tilt in the odds toward La Niña over El Niño. There are some hints in the climate models in this direction, but it’s too early to make a confident prediction (plus we are going through the infamous spring barrier when ENSO predictions are particularly challenging). La Niña conditions two winters in a row are not uncommon, though—for example, we just emerged from three consecutive La Niña winters in 2023.
Of mild interest is the January subsurface temperature in the tropical Pacific Ocean, which was the third coolest January since 1979, when our records of subsurface temperatures begin. The other top 5 Januarys—1999, 2008, 2000, and 2011—were all followed by La Niña the next fall/winter. This isn’t a large enough sample to rely on, though, making this just a interesting factoid at the moment.
Living in the future
Over the past several months, we’ve noted that the global oceans have been much warmer than normal. We’ve also noted that while the ocean component of La Niña is weak, the atmospheric anomalies are currently quite robust, an unusual mismatch. Especially in far flung areas of the globe, the atmospheric anomalies are how ENSO affects climate patterns. To understand why this could be important for forecasting impacts, check out Nat’s early December post exploring the potential for a weak La Niña to have a stronger impact on rain/snow patterns.
It’s likely that the global ocean warmth is affecting La Niña, and one adaption we’re exploring is the “relative Niño-3.4 index.” Whereas our traditional Niño-3.4 index measures the departure from the long-term average (the anomaly) of the sea surface temperature in the Niño-3.4 region, the relative index also takes into account the temperature of the overall tropical oceans. With the relative index, the goal is to better isolate the coupled ENSO phenomenon itself and not the other factors like overall ocean warming. Recently, the relative Niño-3.4 index is quite a bit stronger than the one I showed above, meaning that the warming of the tropical oceans may be hindering our vision of La Niña if we stick to the traditional measures of ENSO strength. It’s like we are in the process of discovering that our prescription glasses may need to be updated in order for us to better track El Niño and La Niña.
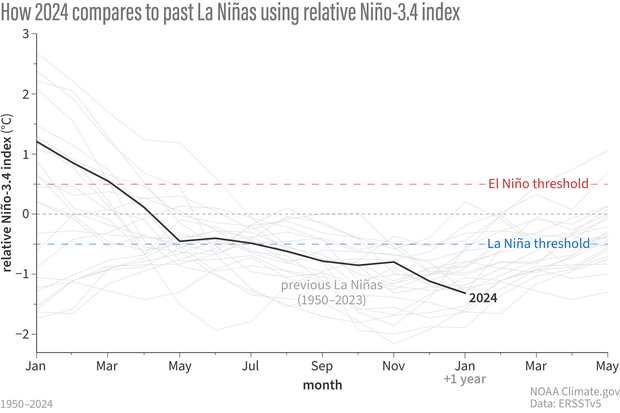
How sea surface temperatures in the Niño-3.4 region of the tropical Pacific changed over the course of all La Niña events since 1950 (gray lines) and 2024 (black line), based on the relative Niño-3.4 calculation. Here, the monthly temperature is compared to the most recent 30-year average, but then the tropical average ocean surface temperature is subtracted, to account for global ocean warmth. By this measure, La Niña conditions are stronger than by the traditional measure. The relative Niño-3.4 index is not our official metric, though, and it needs more research. Climate.gov graph, based on data from Michelle L’Heureux.
For another view, check out how the sea surface temperature anomaly in the Niño-3.4 region looks when we subtract out the entire tropical average anomaly.
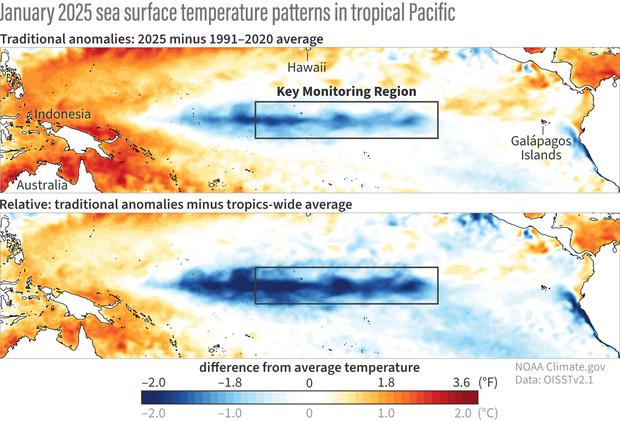
These maps show two ways of looking at the sea surface temperature anomaly (difference from average), with the Niño-3.4 key monitoring region indicated by the boxes. The top maps shows the traditional sea surface temperature anomaly: the departure of January 2025 sea surface temperature from the 1991–2020 average. For the bottom map, the average anomaly across the entire tropical oceans is also subtracted, highlighting how cool the Niño-3.4 region is relative to the rest of the tropics. Figure by climate.gov based on Michelle L'Heureux's calculations.
Turning to the atmospheric response, Michelle graphed the Equatorial Southern Oscillation (EQSOI), which measures the difference in surface pressure between the far western and eastern equatorial Pacific. When this index is positive (i.e., stronger than average), it indicates La Niña’s enhanced Walker circulation. Michelle also looked at cloudiness over the central tropical Pacific—less cloudiness and rain is the characteristic La Niña response.
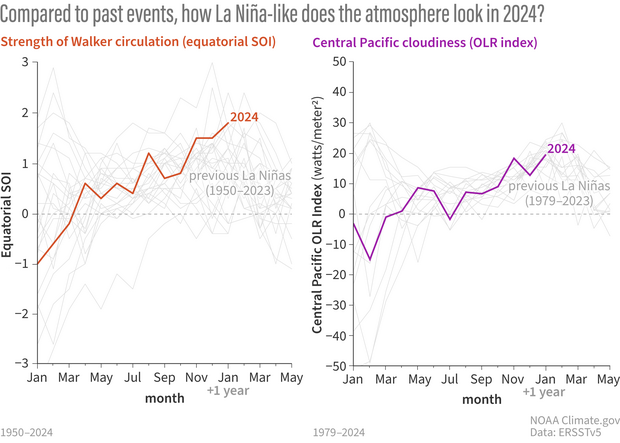
Two ways of looking at the atmospheric conditions in the tropical Pacific: the Equatorial Southern Oscillation (left) and cloudiness in the central Pacific (right). The colored lines show 2024–25, while the gray lines are every La Niña on record since 1979. Both measurements provide evidence that the Walker circulation is stronger than average, a La Niña atmospheric signature, and among the strongest on the record. Climate.gov graph, based on data from Michelle L’Heureux.
As you can see, while our current La Niña conditions are quite weak when you look at our traditional sea surface temperature anomaly, they’re among the strongest by some of our atmospheric metrics. We don’t use atmospheric metrics for official ENSO designations because 1) they are more variable than the sea surface temperature, meaning they can be influenced by short-term weather and bounce around and 2) many atmospheric datasets are more reliable after satellites were widely adopted ~1980, which means we only have a shorter observational record to examine. However, we find the atmospheric metrics are telling us a coherent story—they are impressively La Niña-ish and stronger than what we are seeing in our traditional ocean measures.
See you soon
There’s a lot to look forward to here on the ENSO Blog, including Tom’s upcoming post on two decades of ENSO prediction. I’ll see you back here in March to find out how things go with our current La Niña situation.
Comments
Relative Nina
Wow, I thought there would be a difference between the two measurements but that's a pretty big difference. Does the atmospheric coupling go back to Sept./Oct./Nov as well?
Yup! It's one of the many…
Yup! It's one of the many interesting things about this La Niña. We saw signs of a stronger Walker circulation through the fall, but we were waiting for the ocean surface--as measured by the traditional Nino-3.4 index--to catch up.
ok
ok
Relative index
Interesting and informative post, as usual. The relative index looks promising, even though it sounds like it needs more research.
As an aside, thank you very much for your hard work studying and researching ENSO, and for helping to educate your readers about it. Because of what you do, everyone else's lives are a little easier.
Thank you! We really love…
Thank you! We really love our work, and we're glad to have such a great readership.
Forecast
Thank you for the write-up.
ENSO blog
Outstanding!
Thank you
Restricted data
Why only 30 years, why not 200 or 500 years.
If you use that data it does not make your models work
30 years is the World…
30 years is the World Meteorological Organization's standard for the climatological averaging period. It would be difficult to use 200 or 500 years, because we do not have observations going back that far.
La Nina
The CFSv2 seems to be the farthest looking forward. While a llong way off that model is forecasting positive anomalies and ENSO neutral into November. I hope so. We are getting sick of multi-year La Ninas
Another El Niño and Wet Winter in SoCal 2025-26?
Looks like this round of February rain events are still not enough for this rainy season such as in LA to finish at or above average. I’m thinking that even some Miracle March and April rain may not be enough either. If 2025-26 defies the current model odds to enter another East Based (even weak) El Niño, could there be another wet winter in SoCal again?
It's hard to say much about…
It's hard to say much about next winter with confidence right now, but there is close to a 20% chance of El Nino. We'll know more in a few months, so stay tuned!
Thank you...
Looking to read the March update...
The relative ONI
Dear Emily Becker
Good article. I found intersting the approach of using the whole equatorial Pacific SST to determine their STS anomalies. If la La NIña 2024 started in Jun-july, its impact in 1+2 as clear, as in this región the SST anomalies have been basically negative through almost 2024 till january.
Next time perhaps you could talk about areas 3 and 1+2.
I allow my self to copy this link
DOI: 10.15406/mojes.2017.02.00054
Regards
Thanks! You're right, we…
Thanks! You're right, we sometimes neglect to mention the other Nino regions. I'll try to fix that next month.
2031-2032 defies the current…
2031-2032 defies the current model odds to enter another (even super) El Niño, could there be another wet winter in SoCal again? Like the one of the 1997-1998 again?
We get Triple La Nina year by of 2032-35 like 1998-2001? Possibly. Or a Neutral 2035-36, or El Nino by 2036-37, is moderate. It won't be as Whopper El Nino of 2031-32?
2031-2032?
Thank you for your comment, but I am a bit confused about the focus on 2031-2032. Climate scientists do make decadal climate forecasts (see, for example, this site), but ENSO forecast skill is generally limited to less than 2 years. Any forecast skill beyond 2 years is pretty much limited to the influence of radiative forcing (like greenhouse gases) and very slowly varying ocean circulations, like that of the Atlantic Meridional Overturning Circulation (AMOC). So, basically, I wouldn't rule out anything in 2031-2032!
Winter 2025/2026
Hi Nat,
In the Mid January update La Nina was slightly favored over ENSO Neutral for next winter. What are the signs that are tipping the scale toward La Nina. We aren't close to the Spring Barrier yet so I know they are unreliable. Beginning in February some of the models are showing a spike in SSTs in the 3.4 heading into fall. The BOM Australia blended model shows the same. At least I would think if another La Nina was going to occur that we would see SSTs start to dip during fall.
La Nina double-dip?
You raise a good question, and it's true that there is considerable disagreement among dynamical models now. The NMME has been leaning more toward La Nina re-emerging whereas others (e.g., ECMWF) have suggested that El Nino is more likely.
I will note that two-year La Ninas have been rather common lately - see this recent paper led by Dr. Bin Wang. Typically, one of the main predictors for a two-year La Nina has been the strength of the El Nino that preceded the La Nina and the amount of heat discharge that followed the El Nino. Big El Ninos generally lead to big heat discharge and a longer period for the heat to build back up in the tropics, leading to multi-year La Ninas. So, the big El Nino in 2023/24 might suggest a lean toward a two-year La Nina. That study by Bin Wang and colleagues suggests another factor related to the warming in the western Pacific and the increase in the east-to-west temperature gradient. To the extent that is valid, the very warm western Pacific may also help to tip the scales toward a second-year La Nina.
However, clearly not all models agree, and other factors (including chaotic weather variability) could disrupt any outcome. At this point, I don't know why some models are going against the recent trend toward multi-year La Ninas and showing more warming next fall.
Thanks Nathaniel? A…
Thanks Nathaniel?
A future of consecutive La Ninas with a strong El Nino somewhere in between? I am.looking forward to the IRI/CPC blended model for February this week? Most of California suffered under a La Nina this year
Great Work! Question
Great work and observations by you and Michelle! Follow both you and really impressed by your work. I have a question. During spring barrier time in 2024, the early predictions was for La Nina beginning in mid summer, which my team felt was too fast (we know how reliable models are this time of year). In the summer, the forecast was for La Nina arrival in the late summer/early Fall. But instead we saw arrival mid winter. Do you have any opinions on what held back this La Nina and why the modeling was so off on the timing?
great question
Hi Paul, thanks for your comment and for this great question. I wish I had the answer but it's still a mystery to me. What's odd is that the NMME models were so confident in at least a moderate La Nina as far back as late last winter, and they were confidently wrong. This seems to be distinct from the spring predictability barrier because the models were saying this event was predictable even before the spring.
One factor that may be at play is that we have seen some big differences in the observation-based SST products (you can see that here). I don't know why we see these differences, but it leads to the possibility that some models are being initialized too cold. To support this, we have seen some pretty big Nino-3.4 errors even at very short leads.
I'm sure there are other factors to consider, but we have to dig in to find them.
thank you!
thank you all for all the hard work you do for us! I really appreciate you all and look forward to increasing our weather knowledge and understanding.
thanks!
We appreciate it, Amanda!
Question
What is the difference between El nino and el nina
El Nino/La Nina
You can learn about the basic differences between El Nino and La Nina (and note that we don't refer to any event as "El Nina") from this page, and specifically this blog post. I hope this helps!
Good Read
I've been slowly getting more interested in weather patterns and found this to be a great article that was easier for me to understand without it feeling like it's too simplified. Thanks!
Dynamic vs Static Models
For the 3.4 plots are the Dynamic models more accurate or preferred over statistical models?
dynamical versus statistical
This question is a great lead-in for Tom's post next week - he will cover the details. The short answer is that dynamical models outperform the statistical models in some circumstances, and in other circumstances the dynamical and statistical model performance is comparable.
Thanks Nat!
Thanks Nat!
idk
We love you NOAA pls continue Saving countless Lives!!! shout-out to all of you!!!
Fall Hurricanes?
I understand that the hurricane season this fall may be affected by the state of the Pacific. What are the current predictions and what are some anomalies that y'all find interesting?
Great question and that's…
Great question and that's something that will be examined by the NOAA seasonal hurricane forecast team when they do their official release in May. I'm sure will take in careful consideration the state of ENSO and other climate features when they come up with their determination. In the meantime, here is an blog article from last year that also discussed traditional ENSO-hurricane relationships.
Good read!
First time reader! I really liked your piece! I don’t know much about weather but this felt pretty digestible, and it read really well and easy. Hopefully you guys are still around and I can read up on more weather patterns soon!! You all do great work!
La Niña Asian 2025
Hello!
The Asian summer will be hot because this year’s La Niña phenomenon will not disappear like it will in 2024, but it will remain active in the January, the activity rate will increase by 90% in July, which is why the Asian continent is especially in the midst of a sunny summer.
Teacher RebazAbdwl Geography and Teacher Weather
Comments have been disabled on this article