January 2023 La Niña update, and the ENSO Blog investigates, part 2
Hello from the 103rd Annual Meeting of the American Meteorological Society! Your trusty ENSO correspondent is writing to you from Denver, CO this January. (ENSO = El Niño/Southern Oscillation, the entire El Niño/La Niña system.) Today I have an overview of current conditions and the forecast, before getting back to the question I posed last month—how does ENSO affect daily temperatures during the winter? Let’s get to it, as there’s a lot of ground to cover this month!
Current events
The sea surface in the tropical Pacific has been cooler than the long-term average (1991–2020, currently) since mid-2020, and it remains so. However, we did see some weakening of this pattern over the past few weeks.
Sea surface temperatures in the tropical Pacific Ocean from mid-November 2022 through early January 2023 compared to the long-term average. East of the International Dateline (180˚), waters remained cooler than average, a sign of La Niña. Graphic by Climate.gov, based on data from NOAA’s Environmental Visualization Lab. Description of historical baseline period.
What we did not see weaken was the La Niña-like atmospheric pattern over the tropical Pacific. The atmosphere typically responds to La Niña’s cooler-than-average sea surface with a stronger-than-average Walker circulation: more rain and clouds over Indonesia than average, less over the central tropical Pacific, and stronger winds, both the near-surface, east-to-west winds, and the upper-level, west-to-east winds. In December, all these patterns were still clearly present.
We also regularly take the temperature of the subsurface tropical Pacific, as the water at depth can supply the surface. There’s been a substantial amount of cooler-than-average water under the surface since late summer, but this weakened a lot over November–December. However, the subsurface in the eastern Pacific is still relatively cool.
La Niña is still in force, then. What’s to come, you ask?
Looking ahead
Let’s get right to the punchline: there’s an 82% chance that La Niña will have ended and neutral conditions will reign by springtime (March–May). Forecasting the exact season (any three-month average is a ‘season’ in the ENSO-monitoring world) that La Niña will end (January–March? February–April?) is always challenging, since the range of potential outcomes shown in the forecast models is still substantial even just a couple months ahead. Our dynamical computer models, computer programs that use complex mathematical equations to predict how current conditions will evolve in the future, are leaning toward an earlier transition. However, the statistical models, which make predictions based on how similar conditions from past years evolved, are thinking neutral conditions will arrive a little later. The forecast team is favoring the statistical models’ outlook, in part due to that strong La Niña-like atmospheric circulation I mentioned above.
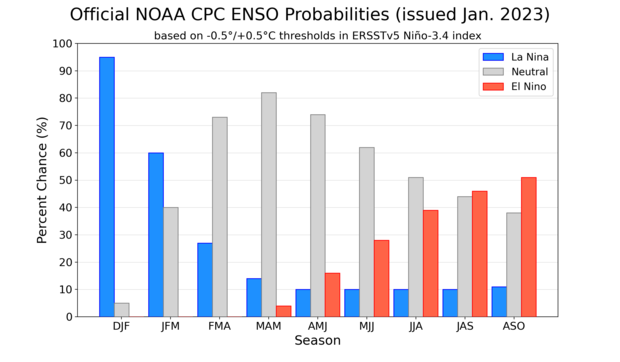
NOAA Climate Prediction Center forecast for each of the three possible ENSO categories for the next 8 overlapping 3-month seasons. Blue bars show the chances of La Niña, gray bars the chances for neutral, and red bars the chances for El Niño. Graph by Michelle L'Heureux.
You may notice those red bars lurking way over on the right of this chart. Is El Niño in store for next fall/winter??? We need to see more signs of El Niño before we would start expecting that. It’s still more than 6 months away, and the probabilities for neutral+La Niña are still pretty close to even with El Niño. Also, since ENSO is a seasonal pattern, we need to be able to expect that El Niño’s characteristic warmer-than-average tropical Pacific would be present for more than one or two months in a row. We don’t have strong physical signs right now, either, like a large amount of warmer-than-average water looming under the surface, and the Walker circulation is still amped up. Stay tuned, for sure—but for the moment, we are not issuing an El Niño Watch.
One more thing to mention this month—California is getting deluged with rain and snow right now with a series of atmospheric rivers. You may be saying “hey wait, I thought La Niña meant California and the southwest would be dry this winter!” It’s true, typical La Niña impacts include a drier-than-average southwestern U.S. and more rain and snow than average in the Pacific northwest. But ENSO only makes certain seasonal impacts more or less likely—it’s not a guarantee of a drier/colder/warmer/wetter winter. If it were a guarantee, it would make our jobs a lot easier! In fact, we have a fairly recent example of another winter that deviated from expected La Niña impacts, 2016–17.
Also, it’s currently impossible to predict short-term weather patterns months in advance. Right now, we can only say that La Niña winters tend to be drier across the southern U.S. Maybe in time we’ll have the capability to predict this type of subseasonal variability months in advance. You can bet there will be a lot of research into understanding the weather and climate drivers behind this extreme rain/snow pattern and if/how climate change factors in.
You promised me daily temperature!
Not a lot of space left in my column for an update on my little investigation into how ENSO affects daily temperature during the winter! So, I’ll just introduce the next steps and get to the details in an upcoming post.
I looked at the winter daily average temperature in December’s post, including the overall range of daily temperature and how that range looked during El Niño and La Niña separately. We found that, generally, La Niña winters had a wider range of daily temperature across much of North America, with some decreased range in the vicinity of the Hudson Bay. El Niño winters were generally opposite.
We certainly had some extreme temperature swings across a lot of the U.S. over the past few weeks—is that you, La Niña? Just like the heavy rain and snow that California is currently experiencing, we can’t take one short-term example and extend it to the entire season. (Again, we’ll learn a lot from the research that will be conducted about this recent weather.)
But the average temperature isn’t what we really notice, as we go about our daily business. We’re more likely to notice the highest and/or lowest temperature.
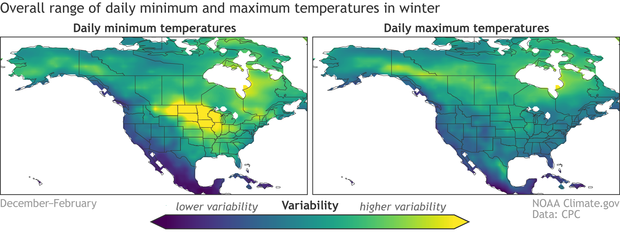
The average variability of daily low temperatures (left) and high temperatures (right) within winter. Yellow regions show where the range of daily temperatures in winter is greatest, while blue shows regions with the narrowest range. The range is assessed using the standard deviation of daily low or high temperature averaged over all winters (December–February), 1950–2020. Daily temperature data source is Berkeley Earth. Map by climate.gov based on analysis by Emily Becker.
Here, we’re looking at the range of daily low and high temperatures during December–February for all winters from 1950–2020. Overall, there is a lot more range in daily low temperatures than highs, especially in the middle of the continent. Only in the subtropical regions of North America do daily maximums vary more than minimums. Details of my analysis are in the footnote.
That’s all I have room to talk about this month! We’ll have to wait for next month to see how ENSO affects the pattern of daily maximum and minimum temperatures we see above and get into some discussion about the physical factors behind these patterns. That is, if there’s time! Thanks for conducting this science-on-installment experiment with me.
Footnote
Details on the analysis:
- The maps show the standard deviation of daily maximum or minimum temperature for each winter averaged over all winters 1950–2020.
- Daily temperature data: I used Berkeley Earth daily average temperature dataset. It’s also available here.
- Years included: 1950–2020. Berkeley Earth is available through near-present, but the data I downloaded ended in 2020. I’ll update with 2021–2022, but I don’t expect the overall results to change.
- Programming language: I used Python. Jupyter notebook available upon request.
Comments
La Nina
One thing for sure. This La Nina is different than the past couple of years. The la Nina the past couple of years had very cold SSTs in the eastern pacific, nino 3 and Nino 1.2 regions. The Nino 1.2 region is rapidly warming as is the Nino 3.
This La Nina is very unique…
This La Nina is very unique in its own right, but keep in mind that these indices tend to vary and evolve over the course of the event. Often the eastern Pacific does warm up as the event draws to a close. The only question is whether it will eventually impact the more central/western regions as anticipated... time will tell.
La Nina
Thanks Michelle!
I guess if you look at the percentage of times La Nina has been drier than average in California since 1950, the last three La Nina years since the wet one during FY16/17 have been drier than normal. I guess we were due for one.
La Niña is one-of-a-kind...
La Niña is distinct in its own way, but keep in mind that these indices tend to fluctuate and alter over the event. As the event draws to an end, the eastern Pacific often warms considerably. The main concern is whether it will finally affect the more central and western regions as predicted... only time will tell.
Southern US Weather Outlook
Does a shift from La Nina to Neutral predict Southern US rainfall and the potential for crop drouths for spring/summer 2023?
Its one of many factors that…
Its one of many factors that forecasters look at. But in general, ENSO neutral conditions in the Pacific mean that ENSO isn't playing a large role in impacting atmospheric conditions in the US.
ENSO transition
This is really interesting information, thanks for the wonderful job!
Just curious to know: The current official NOAA ENSO probability chart shows a probabilistic transition to "neutral" by the FMA period, which lingers until the summer has a (minute) probabilistic shift to "El Niño" by the JAS / ASO period. Meanwhile "La Niña" probability goes down to 10% from AMJ on for the rest of the year...
Take this to mean the probability is "ENSO neutral" on the year, for all practical purposes. However, when stacked up against prior modelling, is this something we can take for granted? Or are there variables in the works that really only present a more concrete picture by say, the MAM period, when winter is in the rear view mirror?
(The science of probability is very fascinating, can imagine the modelling methodology is continually being refined over time!)
Good question. There is a…
Good question. There is a spring predictability barrier (that we've written about before > https://www.climate.gov/news-features/blogs/enso/spring-predictability-… ) that makes it difficult for forecasters to know what will happen with a ton of confidence next fall/winter.
This is one reason why using probabilities is so important. The uncertainty caused by this barrier is taken into account by forecasters when they are making their enso outlook
La Niña, 2023
Hello. I read this post and also the one linked to it which went over the wet winter of 2016-17 in California. And, based on that, I had four questions:
1. How strong is the La Niña this year compared to a normal one? That is, is it normal, strong, or weak?
2. Does it appear to be weakening or strengthening?
3. Any idea what else has been going on in the atmosphere to push these atmospheric rivers into California over the past few weeks rather than further north?
4. When a La Niña ends or is ending, do weather impacts from that tend to be observed simultaneously across the U.S., or do its impacts tend to be observed earlier in some areas than others?
Thank you for reading this, and I look forward to hearing from you.
All great questions.I will…
All great questions.I will try and answer.
1) This La Nina would be considered a moderate strength event with an anomaly of around 1 degree Celsius below average in the central/eastern equatorial Pacific.
2) It currently is weakening and is expected to continue to weaken through the end of winter and into spring.
3) One reason for these atmospheric river events is that the jet stream has been extended across the Pacific pushing these events into California. This happens from time to time in winter although it tends to happen less often during La Nina winters.
4) Impacts are normally observed more in the seasonal totals as opposed to individual events. And they also tend to occur most often during winter. So it's hard to say if a region sees an impact earlier or later than others, as opposed to just in the season itself.
La Nina
Tom, I really enjoy these responses. Such much to learn. I had a discussion with Daniel Swain last year. He told me when assessing the strength of ENSO events he doesn't just look at the SST temps in the Eq Pacific but also how the surrounding SSTs could strengthen the effect of La Nina SSTs. He told me just classifying La Ninas by Nino 3.4 temps was putting La Ninas effect in a box. Really interesting
It all depends on how you…
It all depends on how you plan on using classifications of strength. One reason that Nino3.4 is used (and ssts in general) is due to the longer record we have vs. other metrics that make comparisons between events a bit more uncertain.
ENSO surely is a complex system that will always be more complicated than a simple Nino3.4 sst anomaly can properly capture.
Atmospheric Rivers Relationship with PNA
Tom,
Your comment about atmospheric rivers (AR) and their relationship with the cross Pacific jet stream made me wonder if there is a relationship of AR with the PNA during the winter season? And if there would be a difference in this relationship between ENSO phase and PNA?
Hi Craig, This, it turns out…
Hi Craig,
This, it turns out, is a very complicated question. I did a quick survey of some of the published literature on the relationship between ARs and the PNA, and the results are somewhat conflicting. Some say a negative PNA is related to more ARs, others that a positive PNA is. Another suggested that the PNA provides a lower-frequency modulation of the MOJ influence. Also, the strength, frequency, and location of ARs vary a lot. So my response would be that this is still a very active area of study! However, most of the studies concluded that, between ENSO, MJO, PNA, etc., there are a lot of complex interactions governing AR characteristics.
SST in both the Pacific and Atlantic
As this La Nina comes to gradual close and the SST warm in the Tropical Pacific, does the Atlantic SST cool ?
Hi Stephen, There is not…
Hi Stephen,
There is not much of a connection there. But we do have a post on Atlantic SSts https://www.climate.gov/news-features/blogs/enso/do-you-know-el-ni%C3%B…
ENSO Neutral affect on SW Monsoon
Hello: Here in New Mexico we count on the summer monsoons to hopefully materialize and save us when we experience very dry winters during La Nina years. We experienced an early and very robust monsoon during the summer of 2022 (a La Nina year), which was the only reason a catastrophic man-made forest fire in northeastern NM was finally extinguished. Is there any data regarding the affect an ENSO Neutral pattern has on the American Southwestern monsoon?
Thank you!
Hi! ENSO neutral conditions…
Hi!
ENSO neutral conditions mean that, in general, there is not much influence from the tropical Pacific (or changes in the walker circulation) on atmospheric patterns across the United States.
This means that ENSO Neutral itself won't tell us much about how this years monsoon will turn out. For that, we have to turn to other atmospheric patterns that are more difficult to predict.
ENSO Neutral and GA Severe spring weather
Is there any definitive data on Severe weather episodes in GA (Dixie Alley) during ENSO Neutral springs?
I'd check out this article…
I'd check out this article on ENSO and tornadoes written by Michael Tupper and Chiara Lepore for help answering that question.
https://www.climate.gov/news-features/blogs/enso/enso-and-tornadoes
Weaken La Nina and the Southeast Ridge
With the declining La Nina will the Southeast Ridge also decline ? Since the end of December 2022 the Southeast Ridge has kept Winter weather out of the East Coast and Kentucky among other areas. Snowfall well below normal. Are there indications that the Polar Vortex will return to the Ohio Valley if ENSO / neutral takes place next month ?
Thanks for answering my past questions. By the way Great Article this month !!!
With the influence La Nina…
With the influence La Nina has on the mid-latitudes and the jet stream declining as it weakens, it is certainly possible that it could impact the ridge but not necessarily a guarantee. We'll have to see how other climate patterns evolve to have confidence in what happens.
ENSO Phase Dominance
Since NOAA has recorded stats. on ENSO phases, what phase was the most dominant over the years ? My guess would be ENSO / La Nina. Which would explain the mild and many Winters without Snow here in South Central Kentucky.
I was surprised to learn …
I was surprised to learn (via this table of historical Nino-3.4) that they're tied, with 25 winters apiece. I would have thought that La Niña, which tends to last for multiple winters, would be somewhat more frequent overall. However, 4 of the past 6 winters have featured La Niña, with only one El Niño.
Thank you Emily !
Thanks Emily for the answer to my question about ENSO phase dominance. Good to know why Kentucky has such mild Winters and very few severe Winters.
La Niña is a traitor to Wisconsin
I don’t understand why La Niña is a traitor to wisconsin. california should not be getting wet in La Niña winters I feel El Niño ruin La Niña. Wisconsin does well with snow in La Niña winters. I m [mad] that El Niño is coming that’s not good at all: I hope u are wrong maybe La Niña come back for 4th year or a cold neutral will bring me a cold winter 2023-2024 please don’t left El Niño ruin my winter again
[Editor's note: Reminder, folks. No swearing...now matter how angry the weather makes you.]
I understand your…
I understand your frustration, as a snow lover in New Jersey who has not received any measurable snow so far this winter. However, I wouldn't start writing off the winter of 2023-24 just yet, regardless of how ENSO evolves! There are many factors beyond ENSO that can affect Wisconsin winters. And as this plot shows, the strongest El Ninos have brought warm winters to Wisconsin, but there have been a wide range of outcomes for all other El Nino.
La Nina will continue
La Nina will continue into winter 2024 before breaking in the summer of 2024. Unless sunspot activity does not increase. Meaning the sun will stay weak in the grand solar minimum and temps will stay on the cold side for many more years. We may not see a strong El Nino for around 12 years. Who said the sun is not in control?
LaNina?--Wettest Arizona in Years!
The Salt River lakes are all over 80% of capacity from fall/winter rain. San Carlos Lake (Gila River) was almost dry before fall and is now 2/3 full!
wet Southwest
Hi Bob, yes it's true that U.S. Southwest has been much wetter than typical for a La Nina winter - I recently covered this topic in this post. The upshot is that although La Nina tilts the odds toward a dry winter, chaotic weather variability can cause much wetter conditions, even during La Nina.
2023 El Nino
Is it possible that other factors, besides minor sea surface temperature variations, have more influence over global weather? Cosmic rays......solar output? The 2023 record rainfall event in the Western USA has me thinking!
he current official NOAA…
he current official NOAA ENSO probability chart shows a probabilistic transition to "neutral" by the FMA period, which lingers until the summer has a (minute) probabilistic shift to "El Niño" by the JAS / ASO period. Meanwhile "La Niña" probability goes down to 10% from AMJ on for the rest of the year...
Comments have been disabled on this article